Answered

Quiz with scores for multiple sections

  • 6 September 2021
  • 29 replies
  • 2424 views

Userlevel 4
Badge +2

Hi all,

Does anyone now how to calculate and present to the respondents their scores for different categories of the quiz?
 

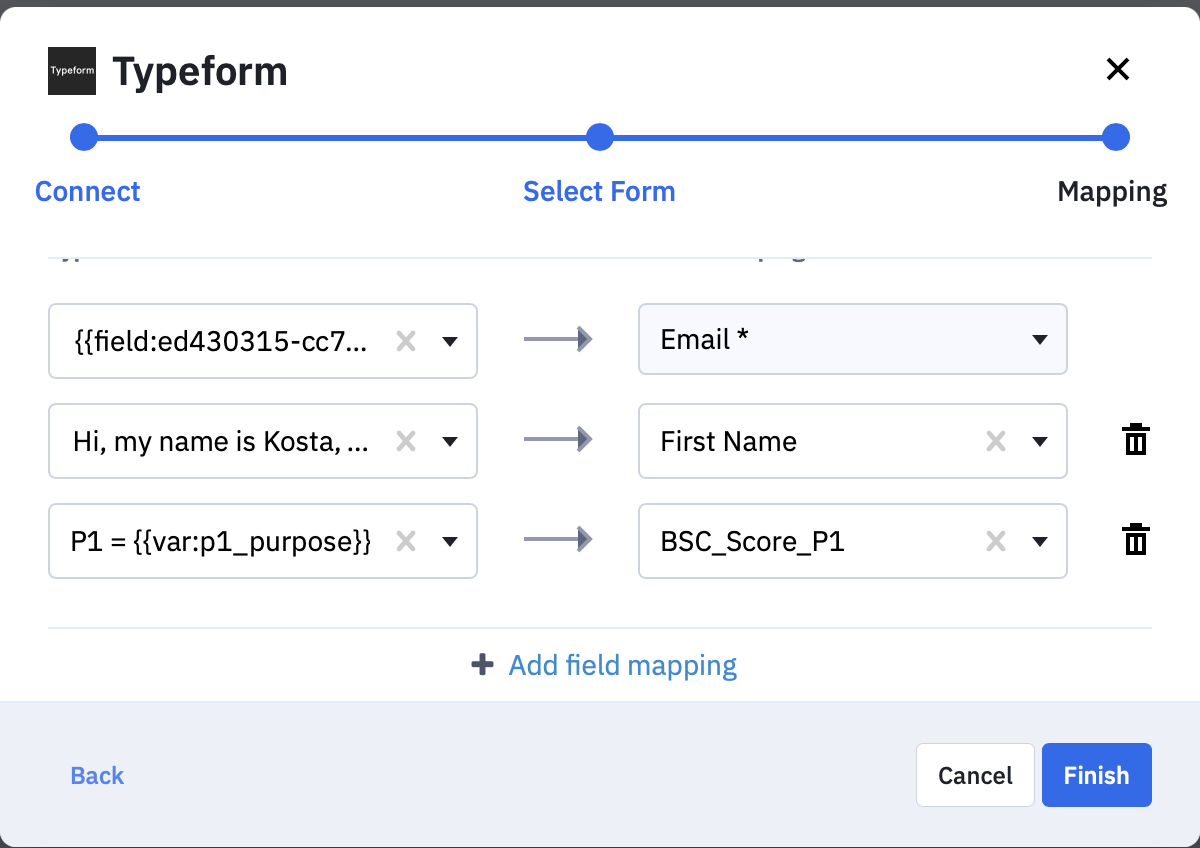
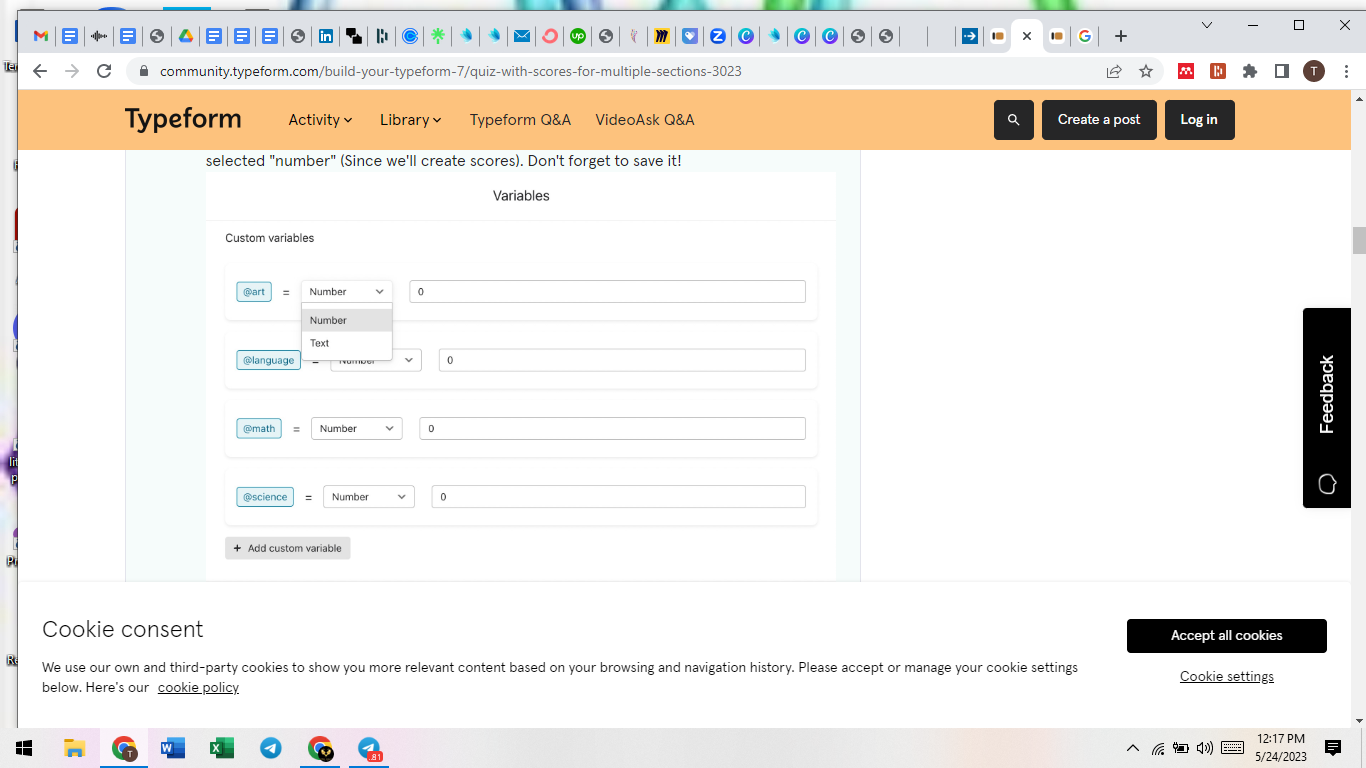
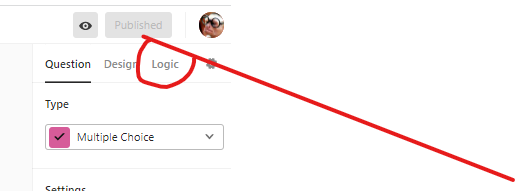
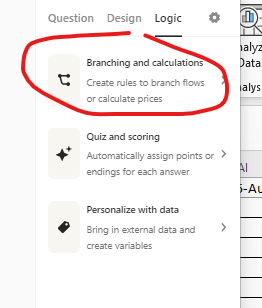
I have a quiz with 25 questions and I have 7 categories and would like to show the respondent their score for each of the seven sections.

Also, is there a way to show the score in a graphical form like a progress bar or only numerically?

Any ideas?

Thanks :)

@Gabi Amaral 

icon

Best answer by Gabi Amaral 6 September 2021, 16:17

View original

29 replies

Userlevel 7
Badge +5

Hey @Kosta! Thank you for posting your question here! :wink:

Yes, you can achieve that using multiple variables adding scores to different hidden fields. In the end, your respondents get their scores in each section. I've created a quiz with branching and calculations to get there, click here to check it out. 

These are the steps you should take:
1. Go to Logic > Advanced > Variables > Custom variables and create your categories over there. In the example above, I've used @art, @language, @math, and @science. Then, I selected "number" (Since we'll create scores). Don't forget to save it!
Typeform - Create 2021-09-06 at 4.06.13 PM
2.  Now, click in Logic > Advanced > Branching & Calculations. For each one of your questions, create a condition to add a score to the specific category if your respondent gets the answer right. Check out the example of my quiz. 
Typeform - Create 2021-09-06 at 4.10.47 PM
3. You'll have to add these conditions to all of your questions. 
4. Then, you'll create only one ending with your respondent's results. You'll have to add your categories over there by recalling information. Take a look at the example of my quiz below.
Typeform - Create 2021-09-06 at 4.13.50 PM
That's it! Let me know if this works for you! 

Regarding your last question, I think you can only display their results numerically. Maybe my friend @Lizhas any ideas about it? 

Wishing you a great week! :blue_heart:

Userlevel 7
Badge +5

@Kosta, @Gabi Amaral is correct that displaying the results graphically isn’t exactly possible, but you could share the URL to the report or create something fancy in Document Studio like in the post below! 


Userlevel 7
Badge +5

Hi @Kosta were you able to give these solutions a try?

Userlevel 4
Badge +2

Hi @Liz, not yet as I’m working on the intergration from Typeform to Mail chimp so I can trigger one of 4 different emails depending on the score form the quiz.

The next stage is to split up the overall score into the 7 sections and display all seven separate scores, then take them into MailChimp and then use dynamic content for the email templates to display up to 21 different paragraphs depending on the score form each section.

Will let you know as soon as I have a go :)

Thank you for the follow up :D

Userlevel 7
Badge +6

@Kosta - may The Force be with you on getting all that done. I am working on something similar with Keap as the target endpoint instead of Mailchimp. 

cheers

des

Userlevel 7
Badge +5

Sounds good, @Kosta ! Let us know if we can help with anything along the way!


Userlevel 1

Sorry to jump on this, but I feel it’s similar to what I am trying to build.

I am wondering if it is possible to convert the scores from numbers to show as a statement instead, so for example if they scored a high number on a section, it could say ‘Well done’ instead of showing the actual number?

Userlevel 7
Badge +6

@JonR - welcome to the community

You can use the advanced logic area to create a text variable - call it v_results for the moment. 

you would then assess the ‘score’ of points in a section (assuming that you have variables created for the section scoring) in a logic rule something like this:

  • if v_section1_score is greater than 20 replace v_results with “Well done”
  • if v_section1_score is greater than 10 and v_section1_score is less than or equal to 20 replace v_results with “close but not quite”

make sense?? 

you could then display the result with the @recall function


des

Userlevel 7
Badge +5

@JonR were you able to give @john.desborough ‘s suggestion a try? :grinning:

Userlevel 1

@john.desborough @Liz Thank you for this reply, I have just got round to trying it today and it worked!

If I have 4 sections of a quiz and they each have their own score, is there a way to display these in the results in order of how well they did, like this:

Thanks for completing your test, here are your results in order of where you performed the best.
section_2 - Score 40
section_3 - Score 34
section_1 - Score 27
section_4 - Score 18

Userlevel 7
Badge +6

@JonR - glad to hear that you got that success out of the way!

in order to put it in descending order you would have to create a set of variables and do some more logic rules to compare the values to determine which was highest, second and so forth. 

then you would recall the ‘highest_section’ and show its score, then 2highest_section and score etc. 


Userlevel 1

@john.desborough Ahh, so it is doable! Just need to work out how to do that, do you know of any walkthroughs for that?

Userlevel 7
Badge +6

@john.desborough Ahh, so it is doable! Just need to work out how to do that, do you know of any walkthroughs for that?

yeah.. i do lol.. i did this type of thing for a client with 12 variables to determine which was highest and included a tie-breaker option in case the top score was identical in multiple variables. if there is no chance of a tie in your score, it makes it simpler - convoluted in the set up in typeform due to the way we have to build logic rules but…

here’s how i did it before and you could repeat:

  • create ‘ranking’ variables for end display: high1, high2, high3, high4 - text and blank
  • create numeric variables for assisting in determining how many ‘gt’ answers - for this quick example something like vs1gts, vs2gts, etc… numeric and 0
  • create ‘comparison’ variables - s1_gt_s2, s1_gt_s3, s1_gt_s4, s2_gt_s3, s2_gt_s4, s3_gt_s4  - numeric and default to 0
    • you will use these to compare the section scores against each other by using some logic rules like this:
      • if section1_score is gt 0 then add section1_score to s1_gt_s2
      • if section2_score is gt 0 then subtract section2_score from s1
      • repeat for all the evaluations
  • now that you have a series of “subtraction values’ in those variables you can start to determine how many ‘gt’ answers you have - the more greater than for a given section score, the higher the ranking
    • we are going to look for clear cut winner first
      • if s1_gt_s2 is gt 0 AND s1_gt_s3 is gt 0 AND s1_gt_s4 is gt 0 then replace high1 with “section1 name” 
        • (we subtracted the scores from the s1 total and if gt 0 in each case then  s1 is the highest and nothing else can beat it, so it automatically gets posted into the high1 variable )
      • if s1_gt_s2 is lt 0 and s2_gt_s3 is gt 0 and s2_gt_s4 gt 0 then replace high1 with “section 2 name”
        • note the first variable is the same but the valuation in this one is lt 0 - that would mean that section 2 score is higher than section one and if section 2 is higher than the others, it would be high1
      • repeat for the other two sections
    • if no clear cut winners you have to have a means to see which section score has the greatest number of gt scores to see how to rank.. 
      • if s1_gt_s2 is gt 0 add 1 to vs1gts
      • if s1_gt_s3 is gt 0 add 1 to vs1gts
      • if s1_gt_s4 is gt 0 add 1 to vs1gts
      • if s1_gt_s2 is lt 0 add 1 to v2gts
      • if s2_gt_s3 is gt 0 add 1 to v2gts
      • etc. 
    •  now you can evaluate which of this last set of variables is highest/lowest  - this does assume that the section scores cannot have equal value ie subtracting one from the other = 0 
      • if v1gts = 0 then replace high4 with ‘section1 name’
      • if v2gts = 0 then replace high4 with ‘section2 name’
      • etc 

 that should get you started down the path of the convoluted method within typeform to do these evals. (i have to bail to do some client related stuff now…. )

much easier to port it into Google Sheets, do the work there and merge the data/output into a template (Doc or Slide), create the pdf and mail it out using an add-on called Document Studio lol.. 


just sayin’ you can pick your poison 

Userlevel 7
Badge +5

Thank you, @john.desborough !! And glad you’ve been able to get this setup, @JonR !

Userlevel 4
Badge +2

Hi @Gabi Amaral,

I finally got round to using the method you outlined above on my quiz with 7 sections and 25 questions. I now have a Brand Power score and 7 individual scores, one for each section. I can present them as static numbers only. I can’t find a way to present them as a percentage and presenting a number graphically means using Google Studio which I still need to try.

My biggest challenge is how do I pass the scores to Active Campaign? I have connected the two together and can get TF to pass the name and email to AC but not the scores. The dropdown list of available elements to use in AC does not include the scores.

I’ve added a screenshot below of the closest variable I can see from TF that is presented to AC when I’m connecting the two together. The name and email comes through but none of the scores :(

Do you know of a way to pass scores into AC?

Thanks :)


Userlevel 7
Badge +5

Hi @Kosta Active Campaign built the integration, so we sadly don’t have any control over the features it have, one of those being the inability to pass the score variable to AC. I would definitely suggest reaching out to them to request this feature though! :grinning:

Userlevel 4
Badge +2

Hi @Liz, thanks for the update :)

The integration is there between TF and AC, it's just that the variables are not being presented so is that a TF issue where the @score and other @variables are not passed onto other Apps?

Thanks.

Hi @Gabi Amaral ,


would you be able to explain how I am able to do the following “Then, you'll create only one ending with your respondent's results. You'll have to add your categories over there by recalling information”. I am right now intending to create a quiz with multiple color sections (ie. yellow, orange, green, etc pp) and based on the answers the people are giving the result should show them in what section they scored the most points. Unfortunately I am not able to create the ending that will display these results.

Thanks alot in advance

Kati

Userlevel 7
Badge +5

Hi @unikati This article here can walk you through recalling information. One thing to note is that this will only recall the answers, so if you want to add in other information, like the questions, you will need to type those manually. 

Hi @john.desborough ,

I am actually trying to duplicate your ranking structure you have explained above. Unfortunately me being a newby to typeform I have to seek your expertise… I have created a quiz with 3 questions per section and a total of 11 sections. Ideally, I would now like to have the results sorted in a descending order. I guess what makes it complicated is that all sections could potentially have the same score (so a tie score is always an option). 

Anyways, when I am now following your explanation above, I already dont fully understand the step with the “gt 0”. What does gt 0 stand for?

  • if section1_score is gt 0 then add section1_score to s1_gt_s2
  • if section2_score is gt 0 then subtract section2_score from s1

and what are ‘gt’ answers?

  • you can start to determine how many ‘gt’ answers you have - the more greater than for a given section score, the higher the ranking

I guess and hope that once I have this sorted out, the rest should be more straight forward ;-)

Thanks alot for your help. 

Userlevel 7
Badge +6

@unikati - gt means greater than.. so gt 0 means greater than 0 

Userlevel 7
Badge +6

@unikati - also note that the ability to rank() the scores does not exist in native Typeform logic

you would have to push the data out to Excel, Google Sheets or some other data tool to do the ranking or sorting into a descending or ascending order. 

des

Good day. I have been trying to make the above logic work for a quiz with three distinct scores. I can’t find the same advance settings for logic as was posted in the above screenshot. 

@john.desborough @Gabi Amaral do you have any insight on this? Did they change these options? Is there a work around?


Thanks so much for your support!

Userlevel 7
Badge +6

@upliftlearning 


that should get you started


des

Userlevel 1
Badge

Hallo,

Can we set the quiz score result per dimension? For example, in a quiz, I have 3 dimensions, I want the score output to be different for each dimension, is it possible? If so, how can I do it?


For example:

Dimension 1: there are 3 questions, there will be a separate score output for this dimension.

Dimension 2: there are 3 questions, there will be a separate score output for this dimension

Dimension 3: etc..


Thank you

Reply