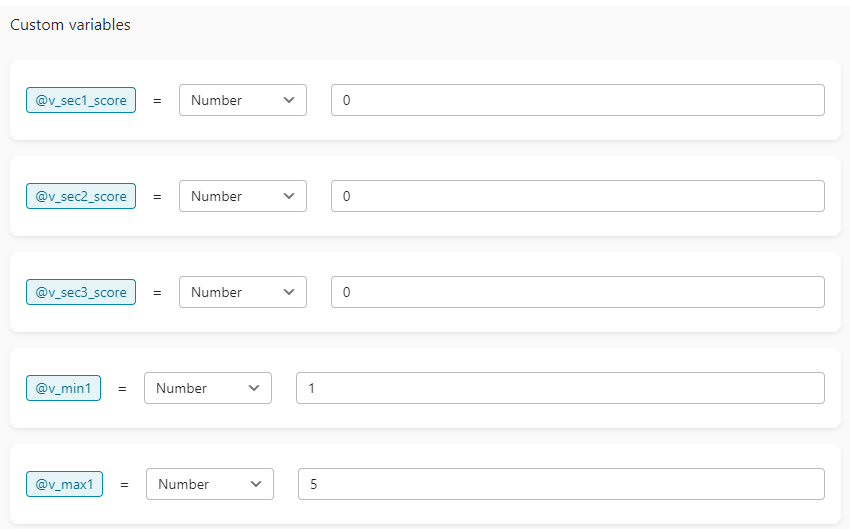
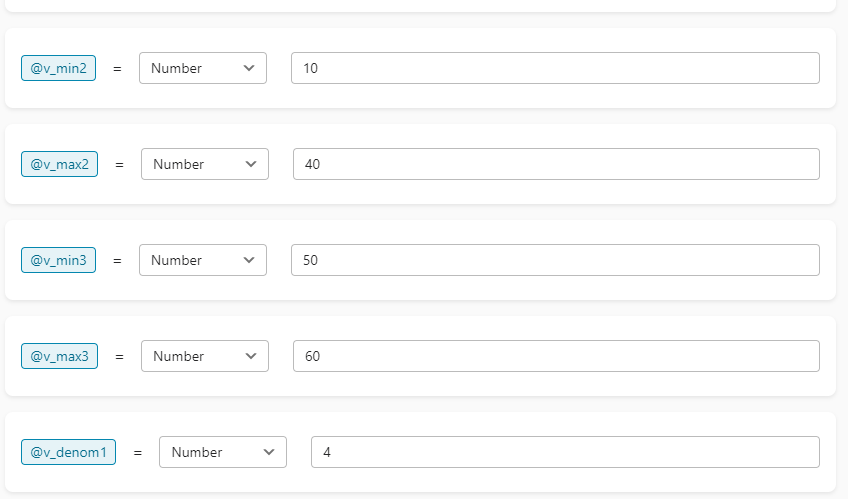
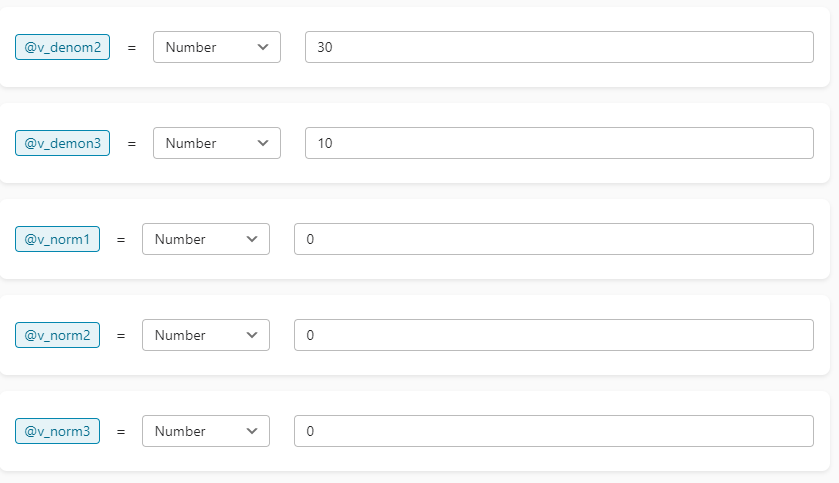
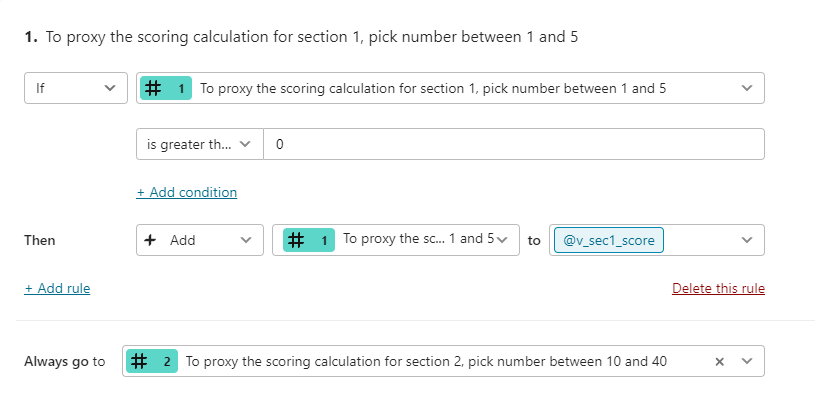
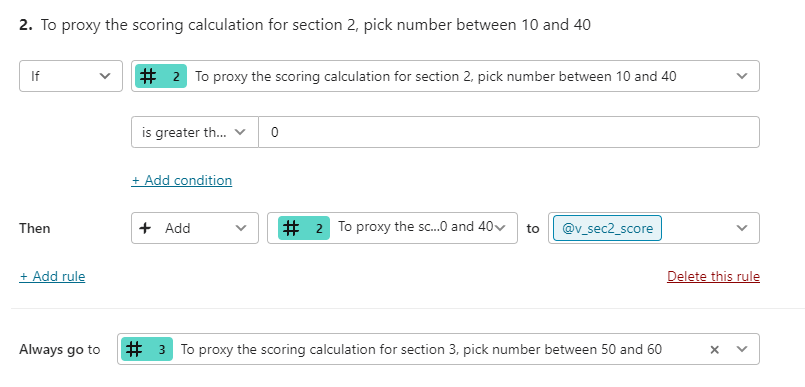
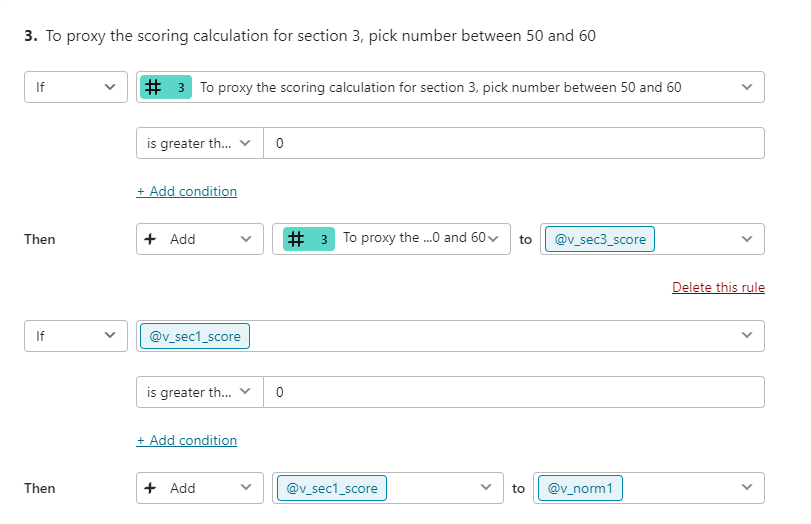
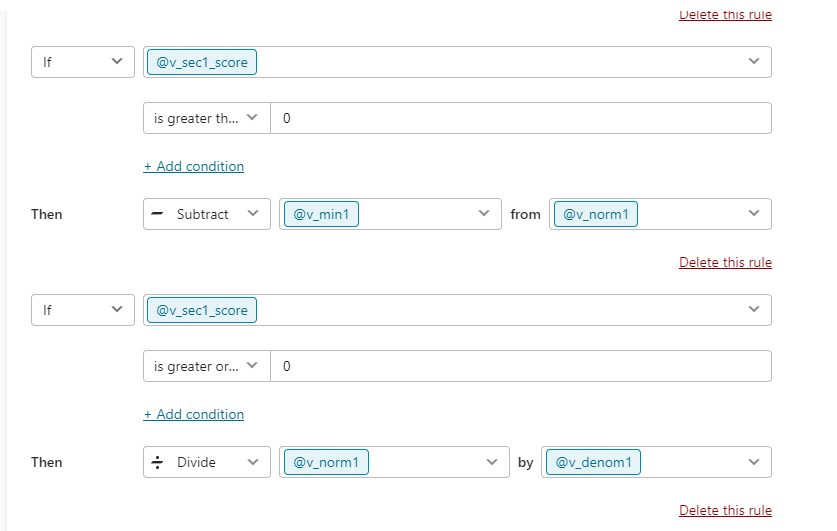
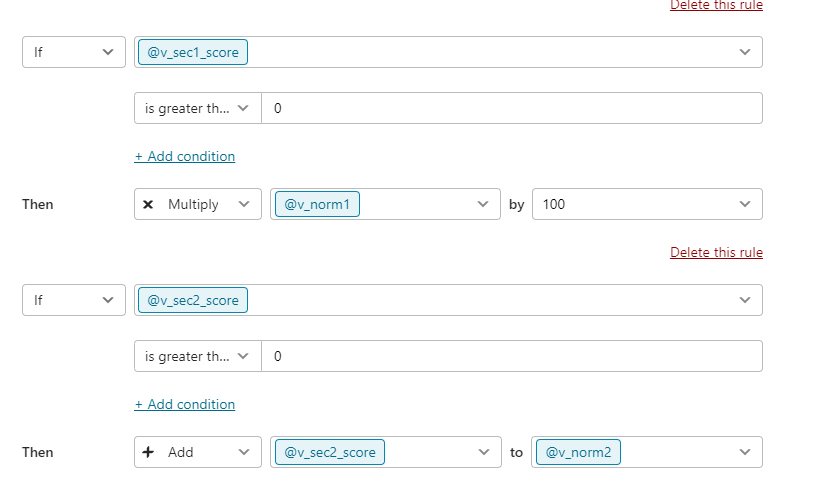
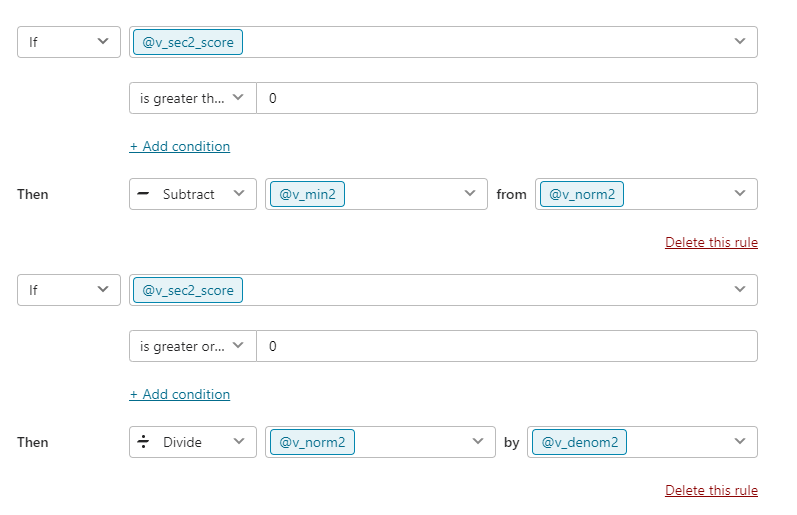
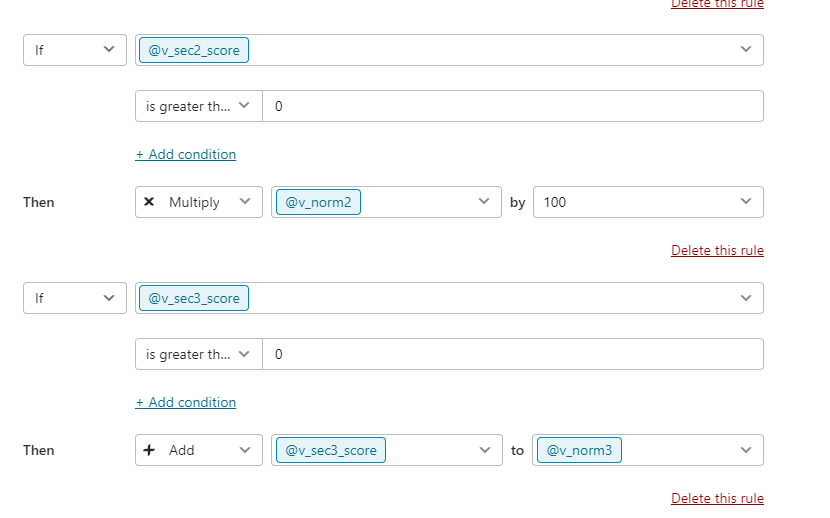
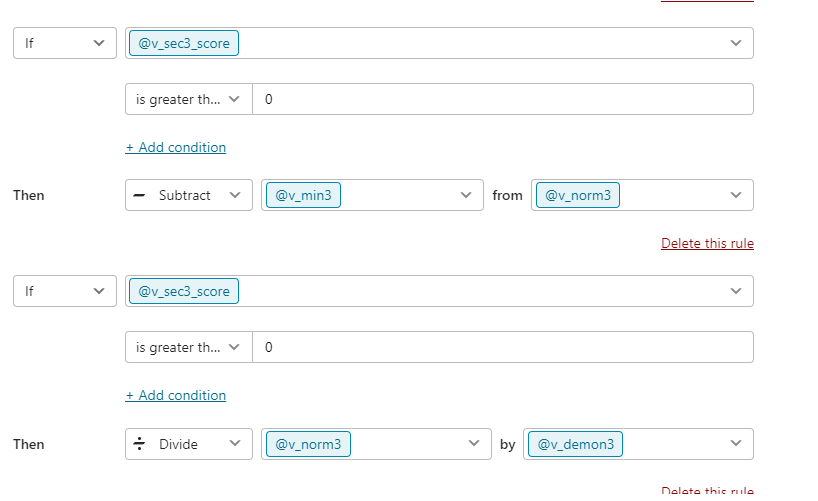
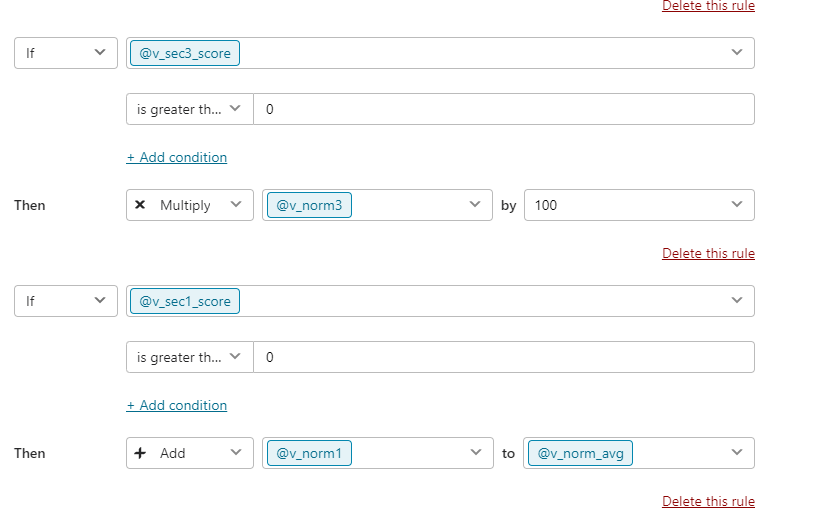
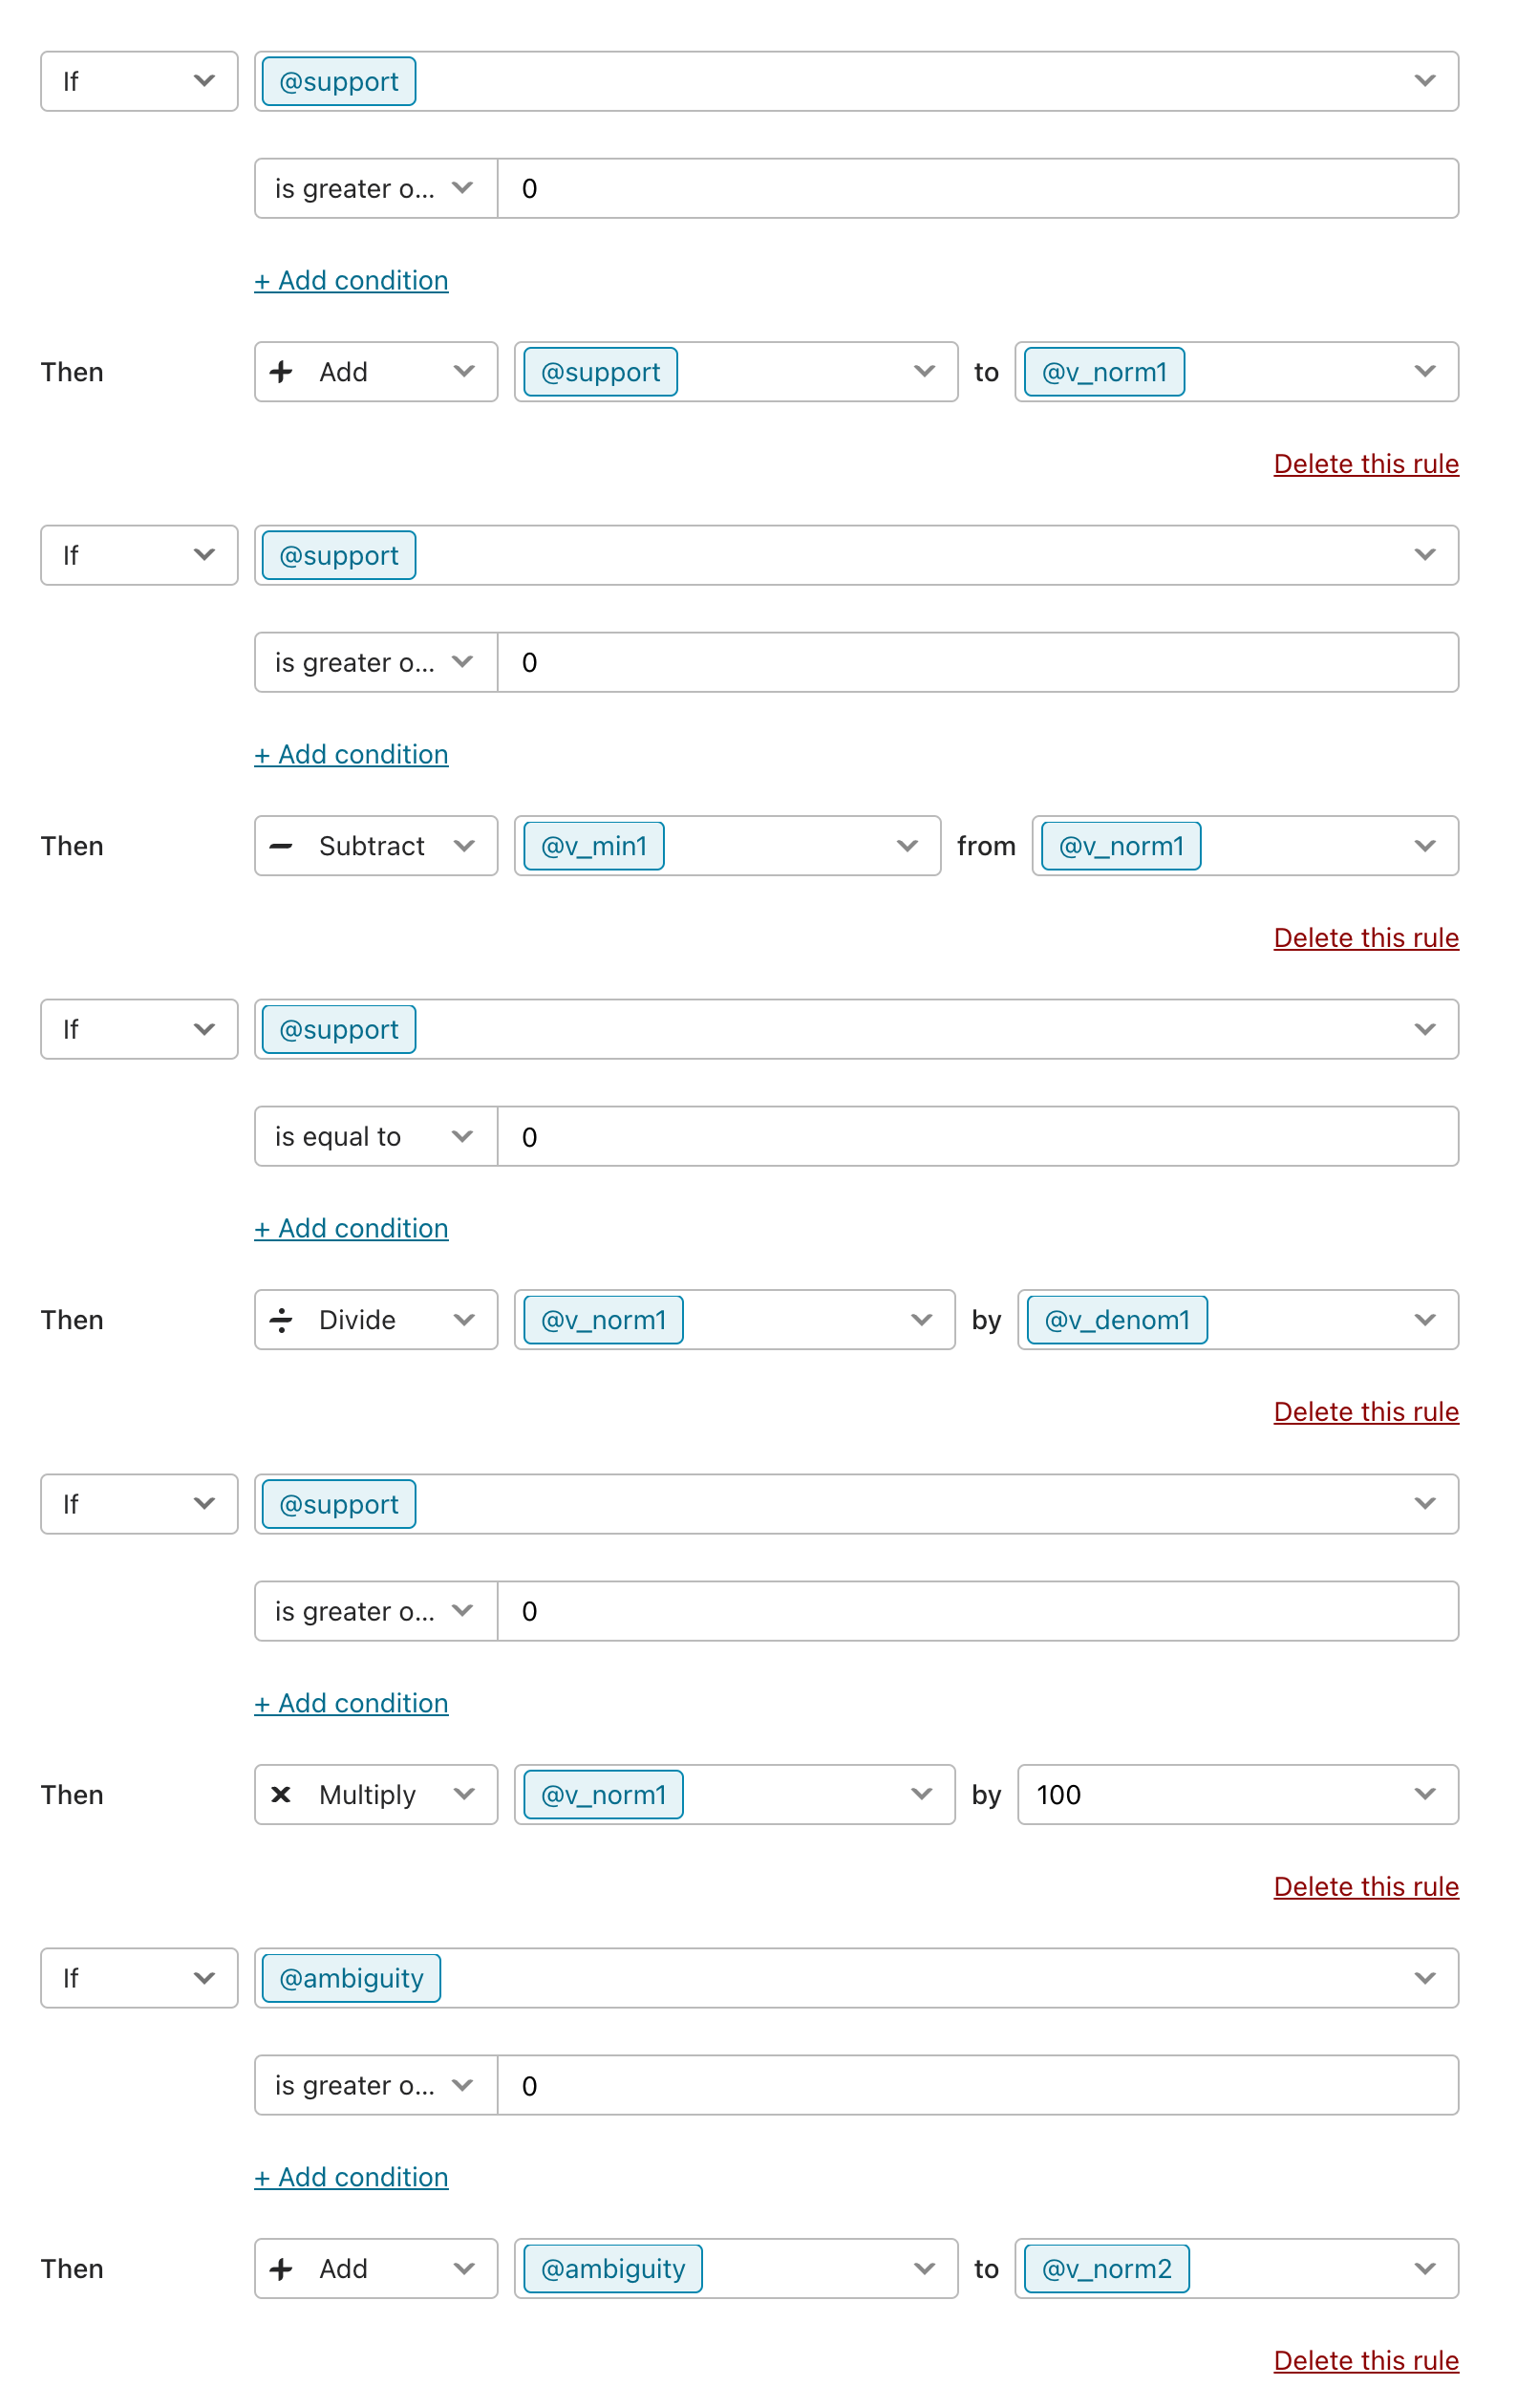
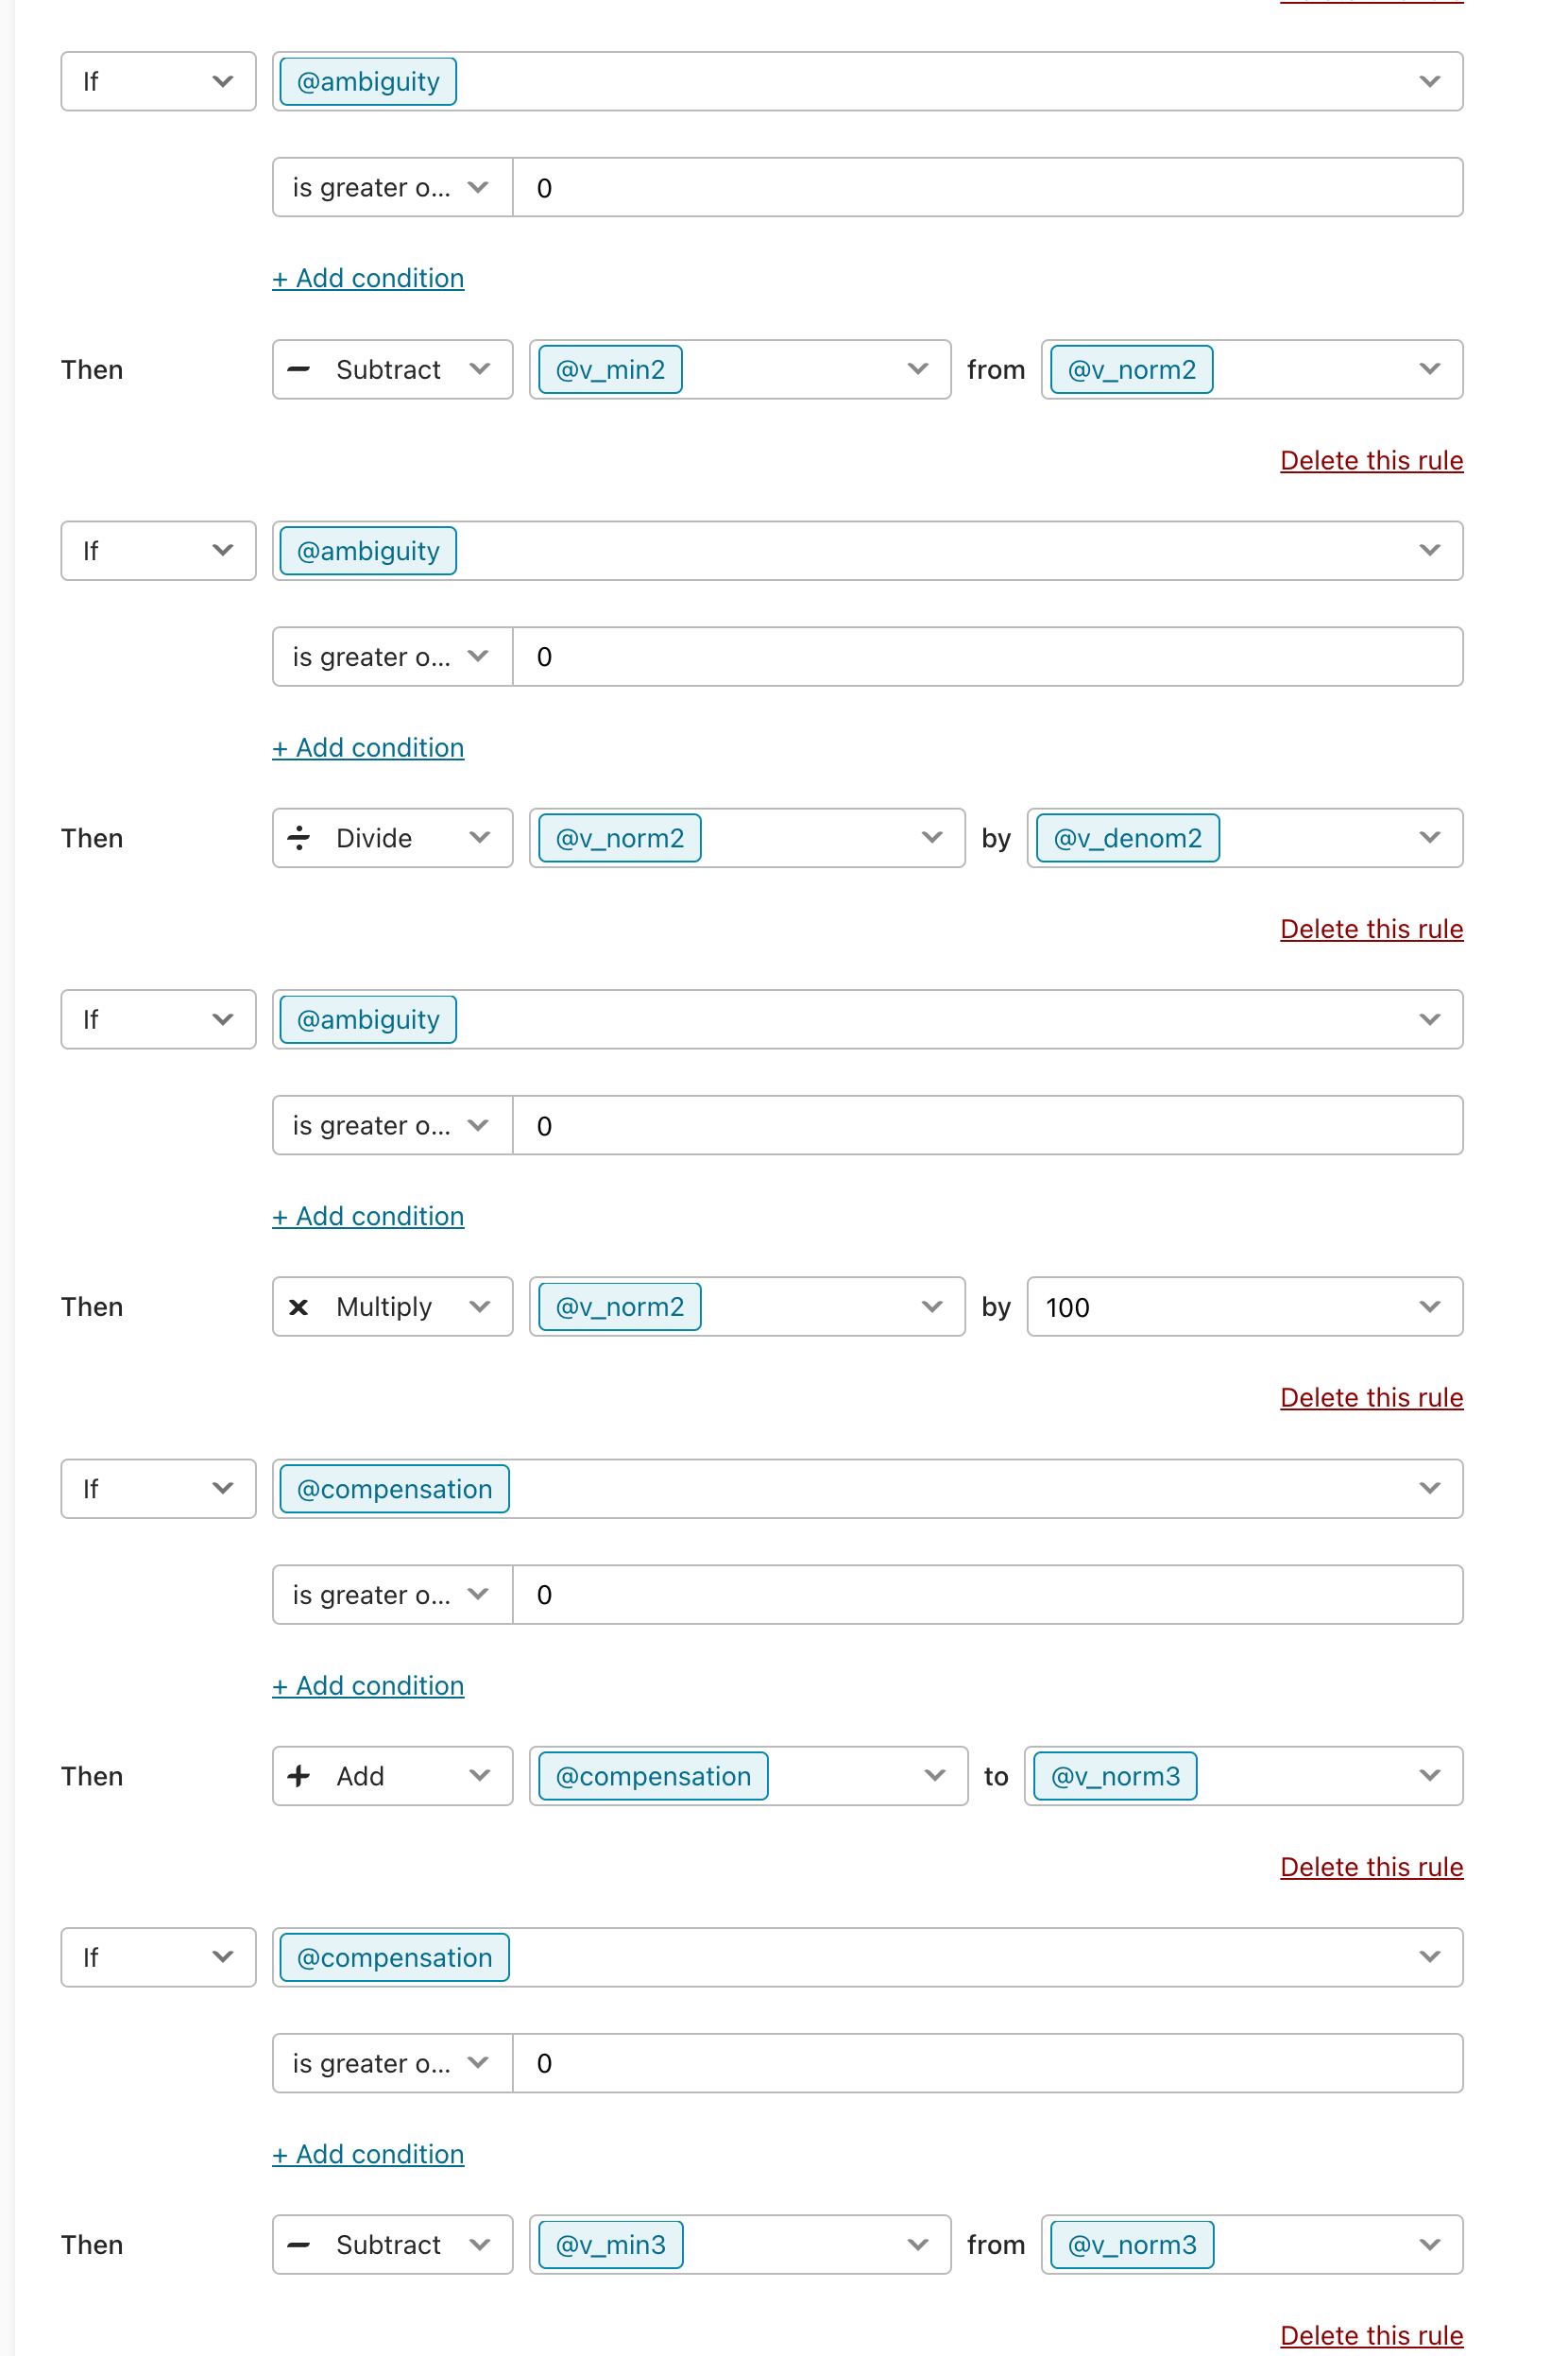
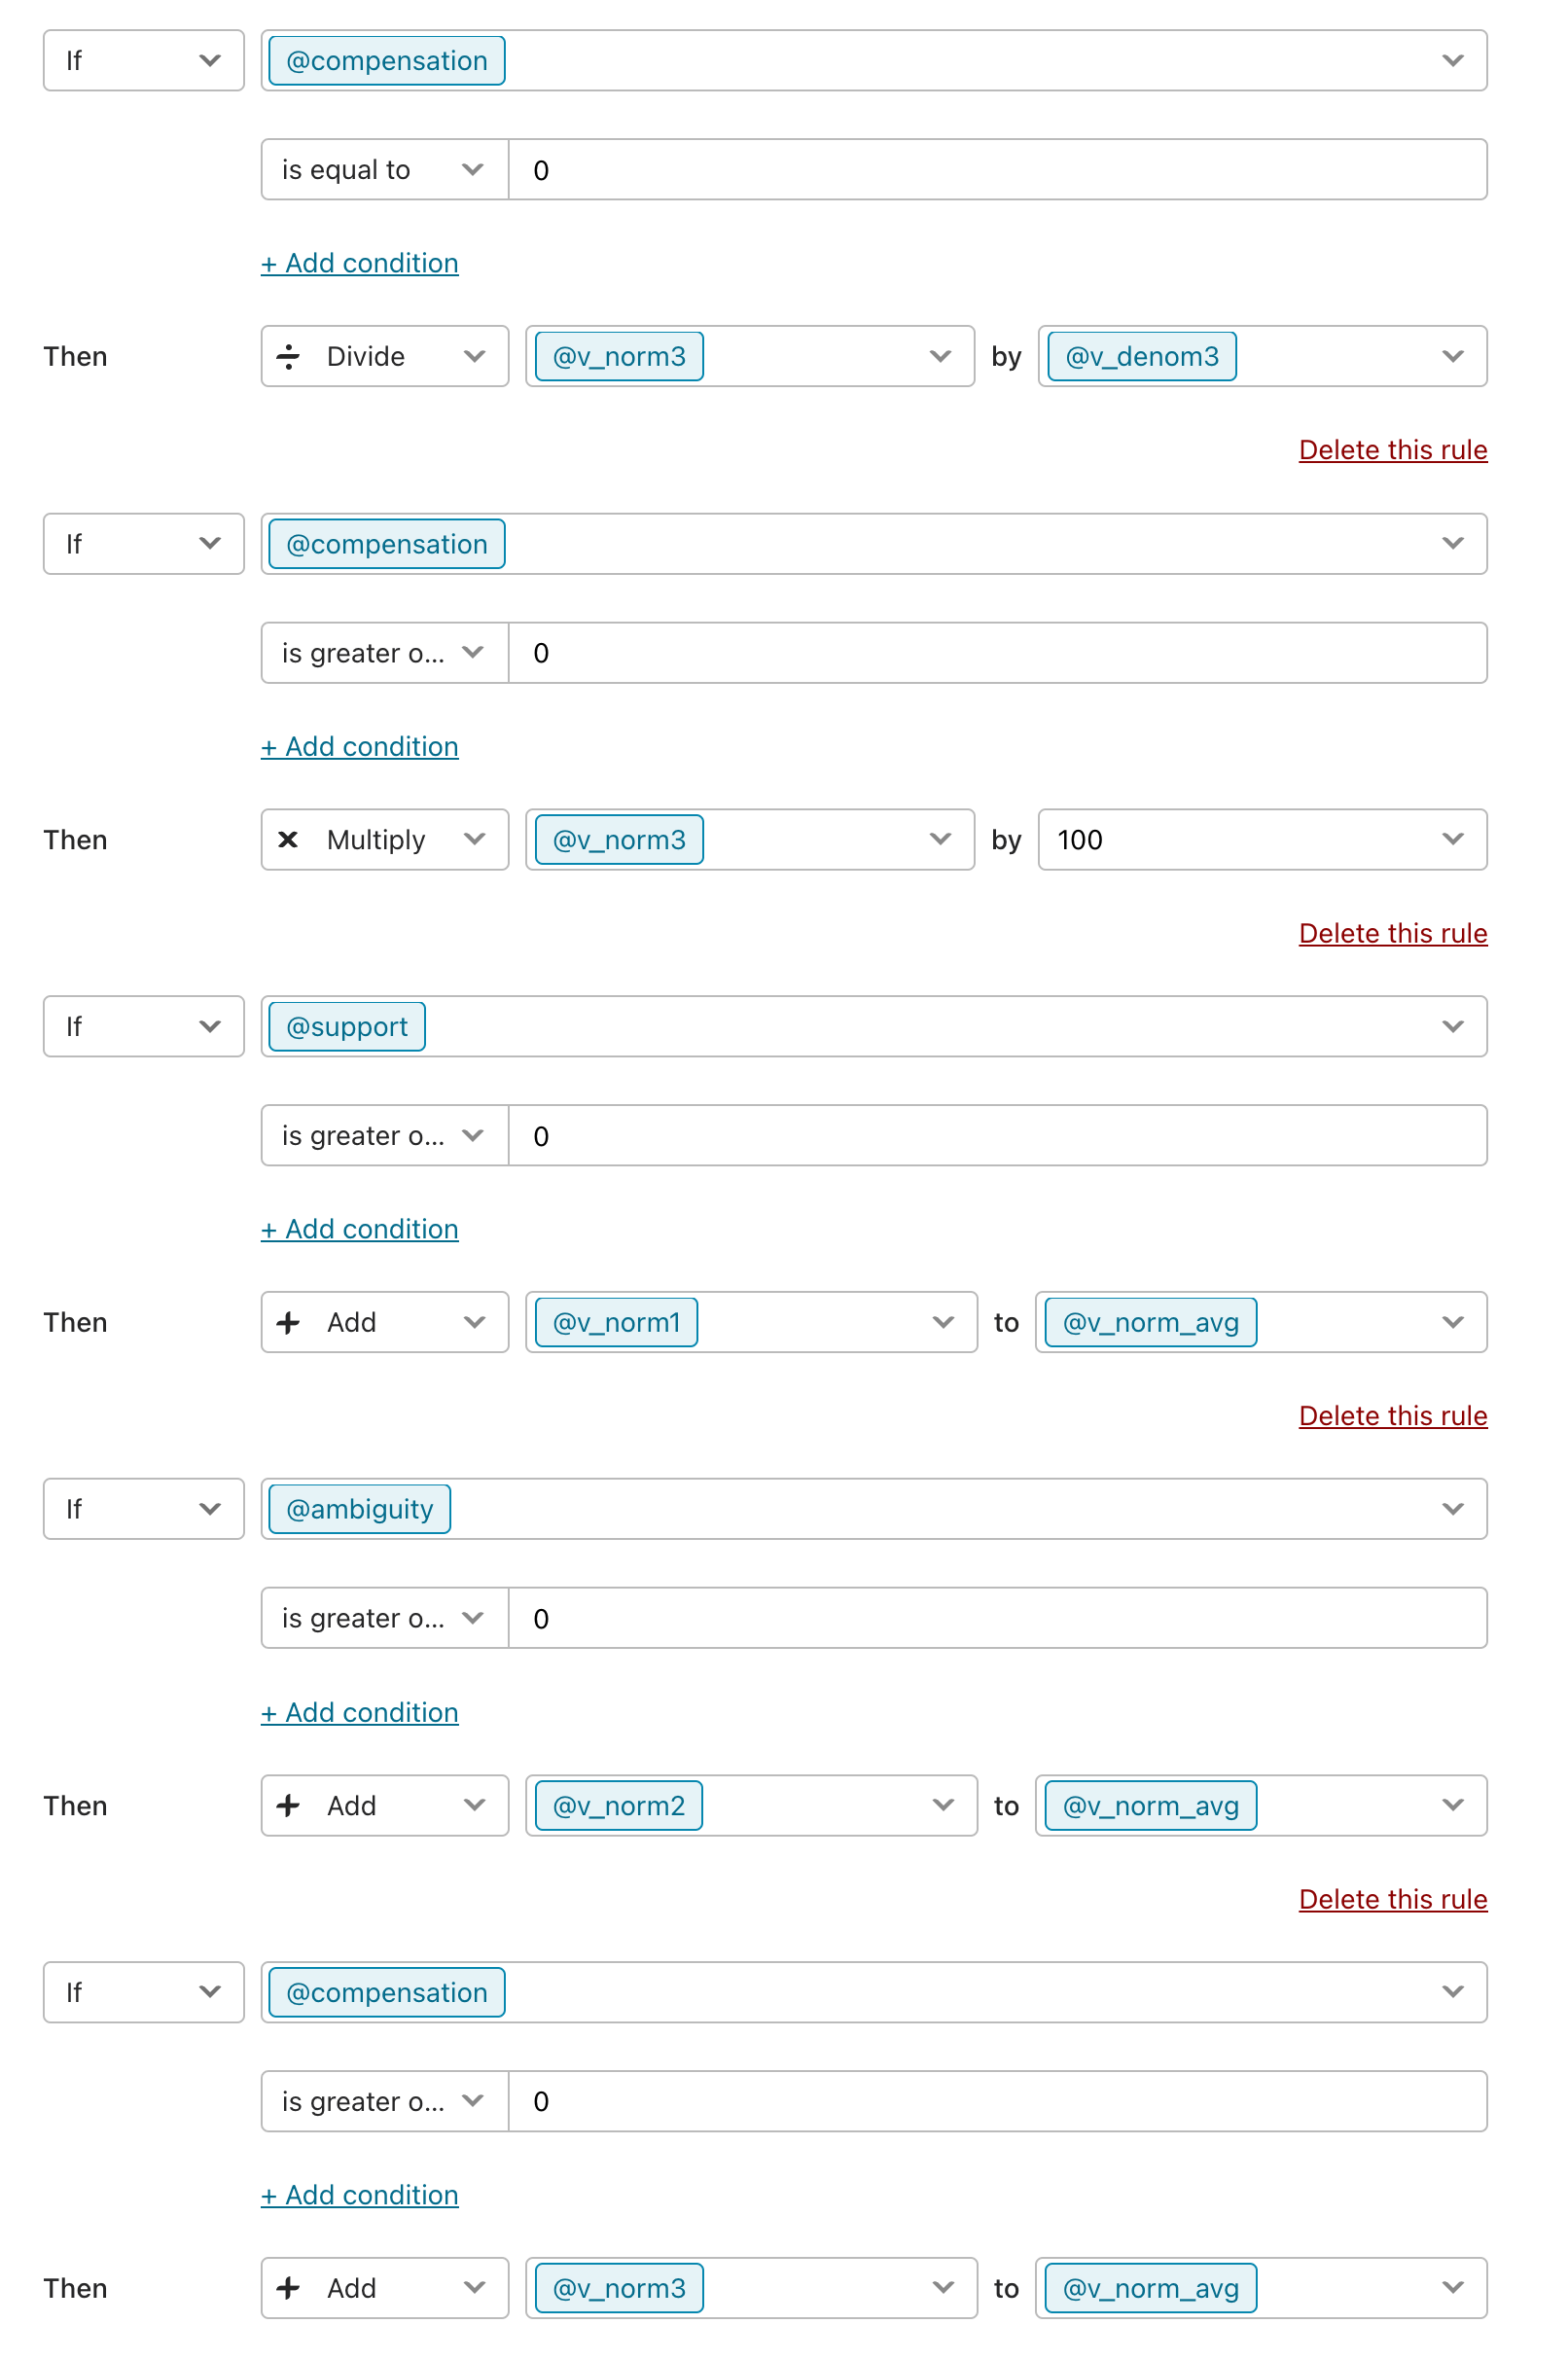
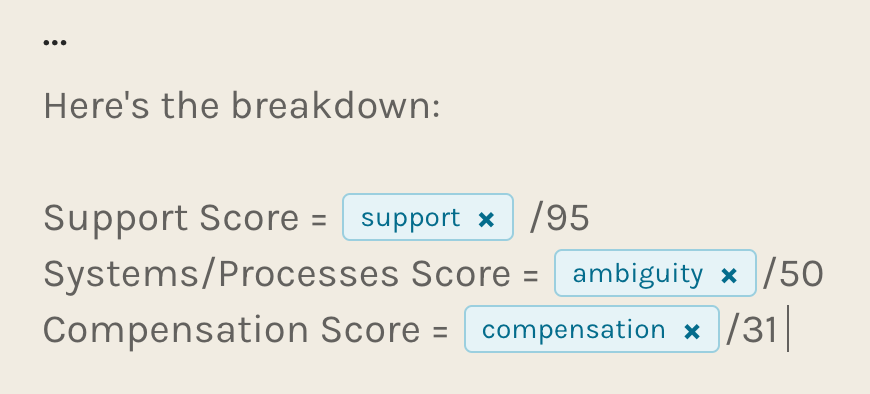
I’ve created a quiz with questions broken out into 3 sections and provides a score for each in the end. From there I need to normalize the data set between 0 and 100 for each section. Since each section has a different scoring criteria this normalizes each number into a percentage and a number that makes more sense.
= (score – min(x)) / (max(x) – min(x)) * 100
How can I present the information this way at the end?
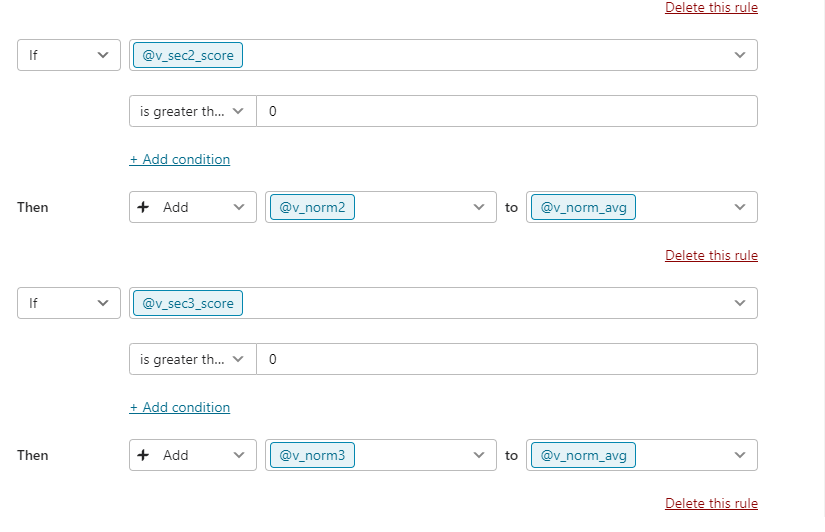
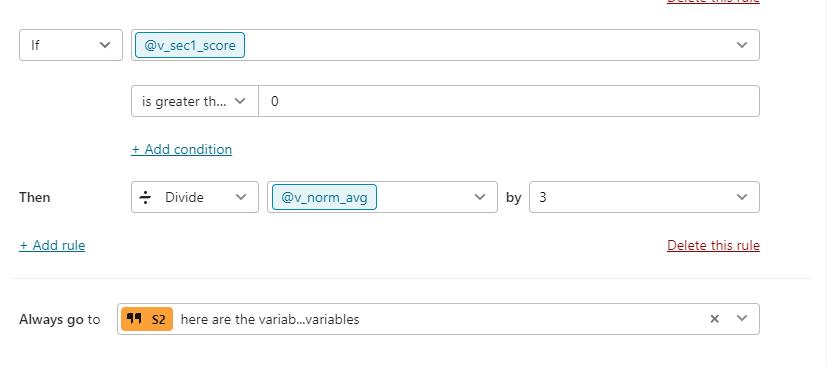
Secondly, I would like to have different outcomes based on the scores from three different groups. Is this possible? For example let’s say the scores after being normalizes are as follows:
Section 1 - 60%
Section 2 - 70%
Section 3 - 30%
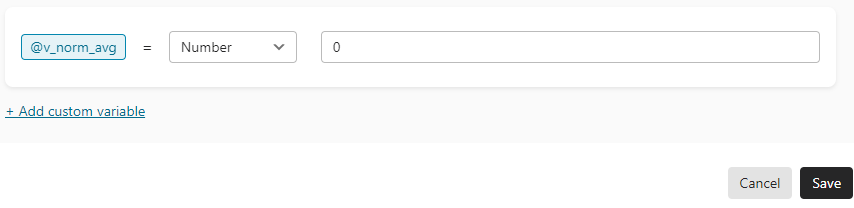
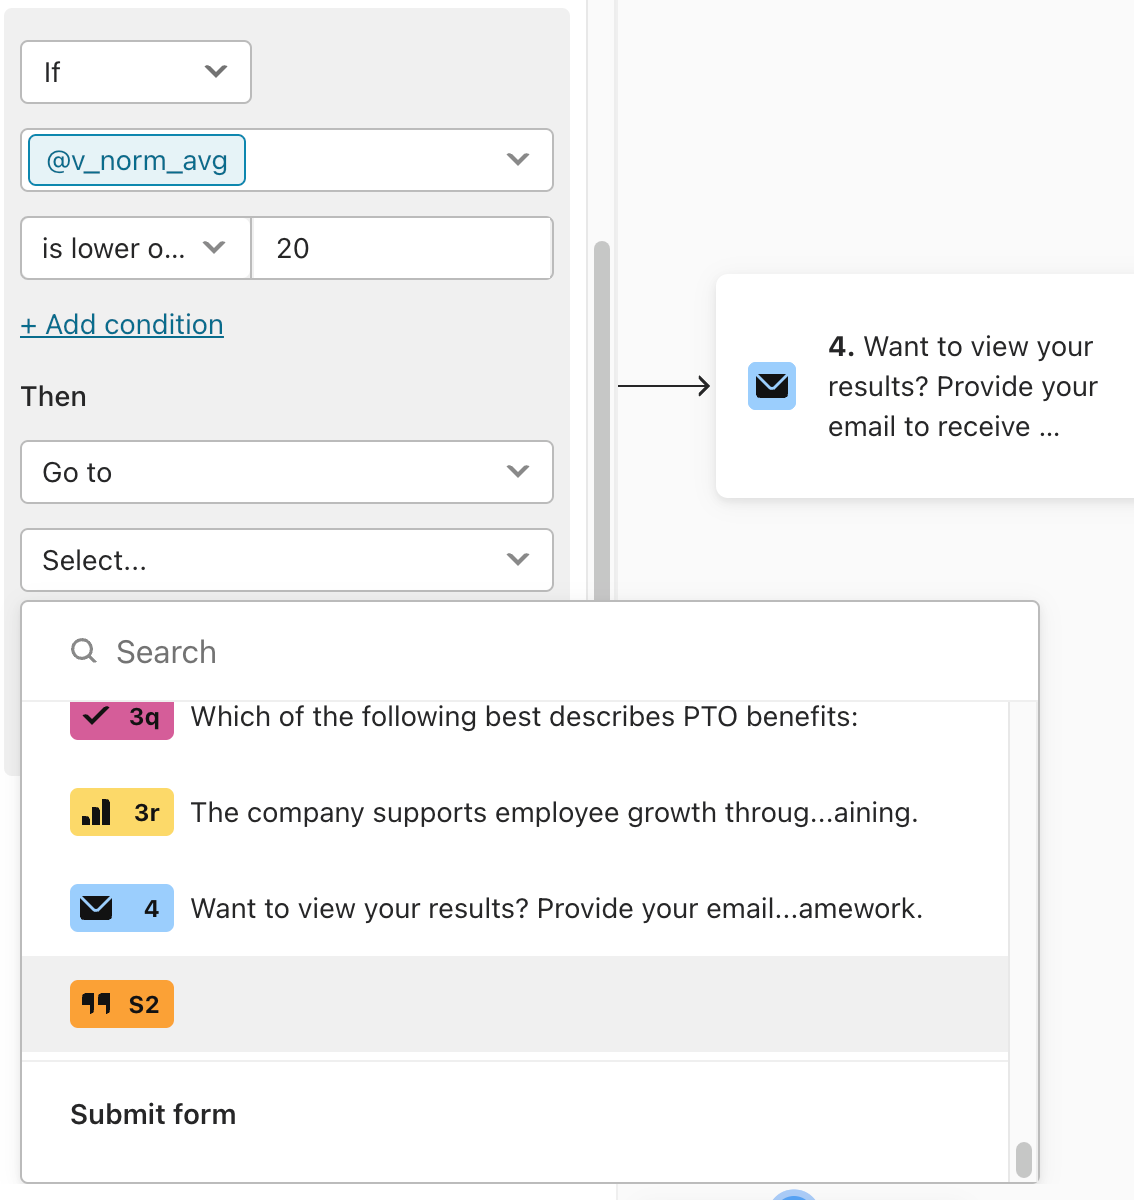
From here I want to take an average of these scores and show different endings.