Under the Results tab -> Insights and Summary, the data is aggregated based on all views and responses from all users.
Question: Can the Insights/Summary shows stats based for a given survey member?
Requirement: We want to see how the a given survey end user response (numeric) have changed over time
Design:
Let's say the developer defines the key columns (email_id or first_name and last_name) that identifies a specific user
A drop down would let the developer select all or a given survey user
The stats should then show the total views/submissions for that member.
Another drop down to filter any column of type DateTime to filter by dates. Here we could filter by Submitted Date
A way to define one or more charts and the fields for each
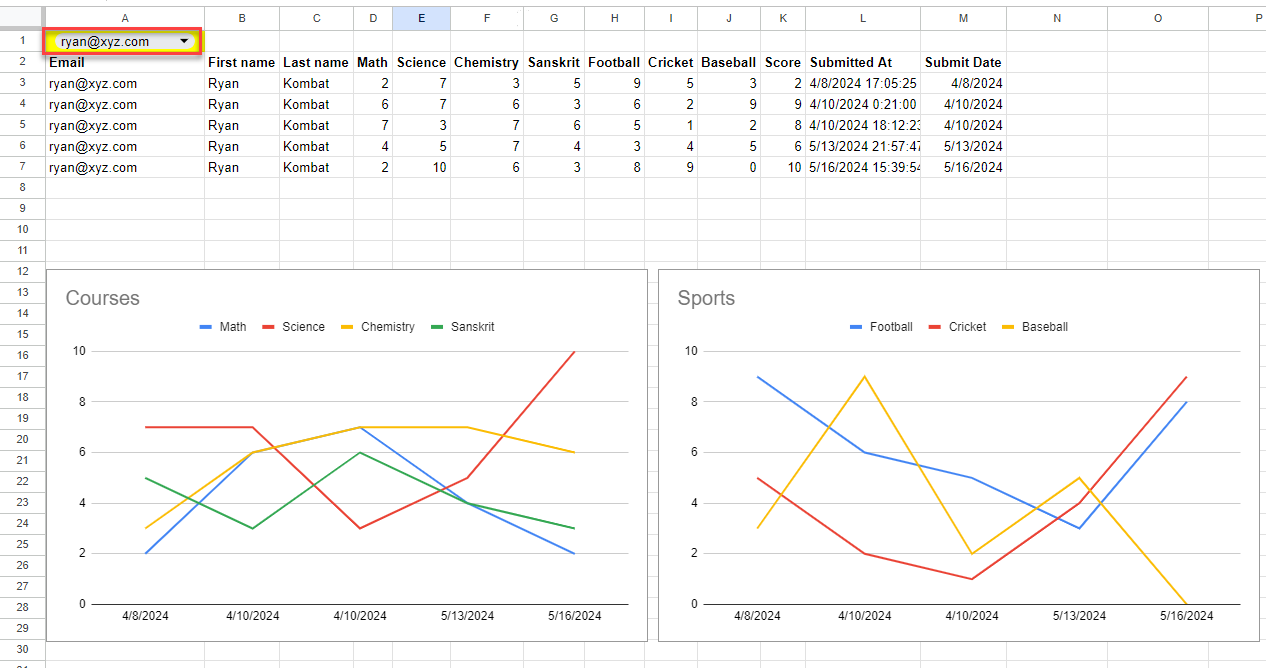
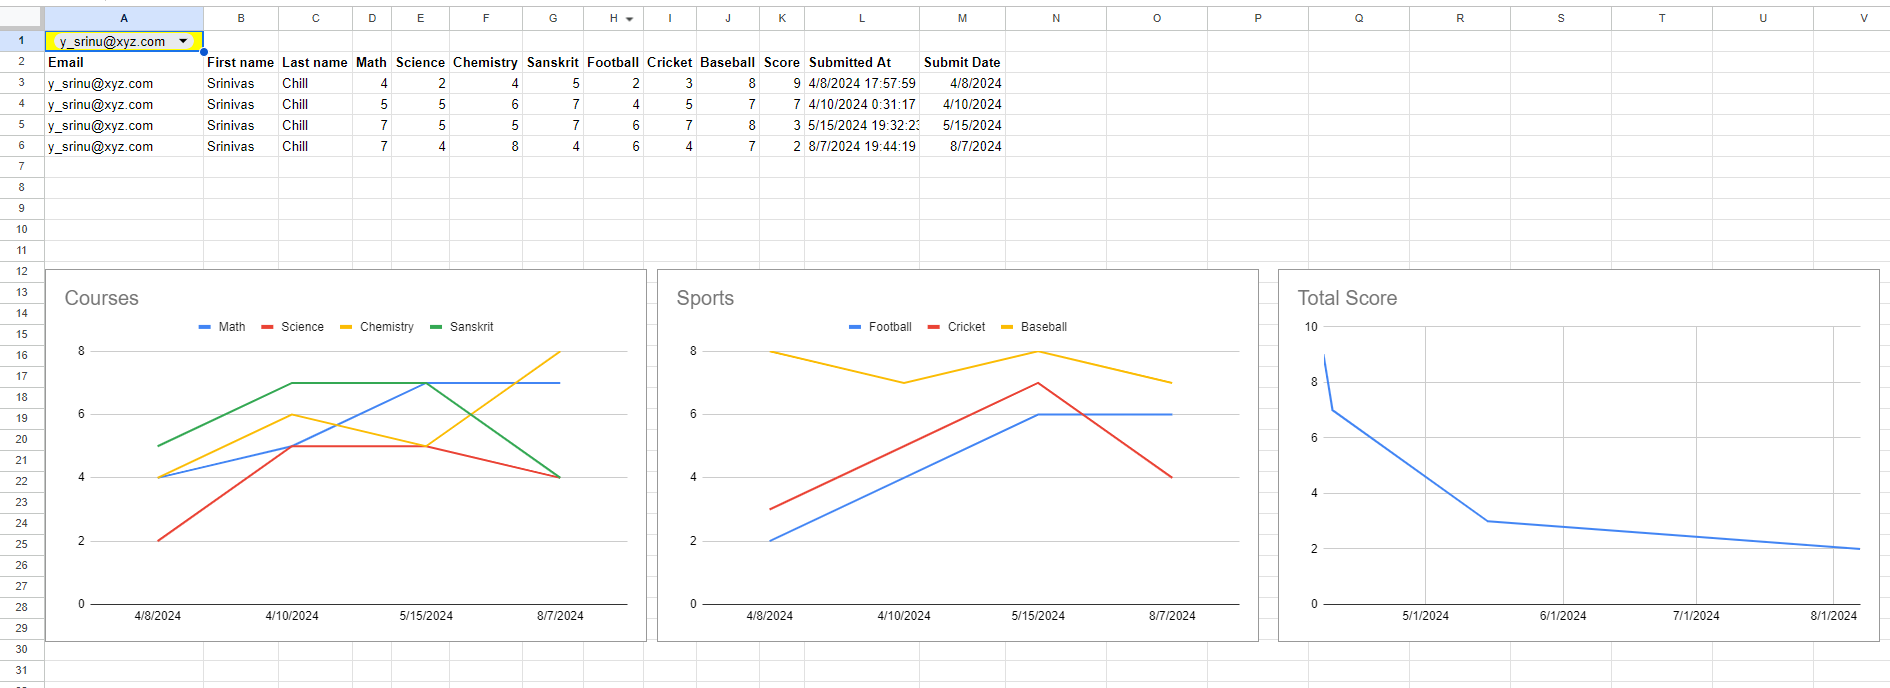
I replicated the design in Google spreadshet as below, in the sheet 'Score' I have all the raw data.
In the sheet 'Chart' (shown here), the drop down at the top shows the unique emailIDs from from the first sheet. A function would only display the rows from Score sheet onto Chart sheet where the email matches the selection.
The chart display data for the filtered rows. Each chart for a unique set of fields.
The Typeform today shows the Big picture with Trends chart. If Typeform can display results and chart by specific survey member, as I did in the Google sheets, then Typeform would be one-stop-shop for most of the reporting features and developers will be less dependent on 3rd party tools.