Radar graph from quiz results | Community
Skip to main content
Answered

Radar graph from quiz results


Sweendawg

I’m adding a personality quiz:

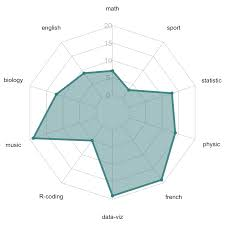
  • There are seven categories and respondents will get a rating from 1-10 in each category
  • I want to display the results in a radar graph like this at the end of each survey:
  • Can someone help with the logic of creating this, and is it even possible? 

Best answer by Liz

Hi @Sweendaweg thanks for stopping by! This radar looks super cool. I’m afraid we don’t have a way to show the results like this within Typeform, but we have quite a few integrations here that you might be able to send the data to and create a graph like the one in your screenshot. 

View original

18 replies

Liz
Community Team
Forum|alt.badge.img+5
  • Tech Community Advocate
  • 15012 replies
  • Answer
  • April 27, 2021

Hi @Sweendaweg thanks for stopping by! This radar looks super cool. I’m afraid we don’t have a way to show the results like this within Typeform, but we have quite a few integrations here that you might be able to send the data to and create a graph like the one in your screenshot. 


Forum|alt.badge.img
  • Socializer
  • 8 replies
  • July 21, 2021

Hi @Sweendawg 

I was wondering if you found the right integration ?


I am looking to add a doughnut chart composed of different variables created in my typeform. @Liz , do you think it will be possible to do that ?


Thanks !


john.desborough
Forum|alt.badge.img+6
  • Certified Partner & Champion
  • 5305 replies
  • July 21, 2021

@Spike @Sweendawg - this comes from another user

It’s possible to generate these types of graphs by integrating your typeform with Google Sheets and creating a separate tab (or tabs) to do the analysis and graphing. You can then include these graphs into a Google Slide doc and convert to pdf for emailing - i use the Document Studio add-on to enable all that to happen. 

(you just need to create your Google Slide doc as a template and then set up the merge inside Document Studio) 

You can also use Google Data Studio if you want some more robust graphing and reporting 

cheers


des


Forum|alt.badge.img
  • Socializer
  • 8 replies
  • July 21, 2021

Thanks @john.desborough for your prompt answer !


That is a great thing to know. What I would like to is to directly show the result at the end of the form in form of a doughnut which take the value from Typeform variable.

Cheers !


Liz
Community Team
Forum|alt.badge.img+5
  • Tech Community Advocate
  • 15012 replies
  • July 21, 2021

Hi @Spike If you’re using the workaround @john.desborough ‘s providing, you would need to use the redirect feature to direct your respondents to the graph since it isn’t possible to add it directly into the form. The upside of this though is that you could add that info to your site and make it look as fancy as you’d like there!


Forum|alt.badge.img
  • Socializer
  • 8 replies
  • July 21, 2021

Hi @Liz ! Thanks a lot for your answer. I will try what you suggest.


Just to be sure, is there any integrations that does that within Typeform ?


Thanks !


Liz
Community Team
Forum|alt.badge.img+5
  • Tech Community Advocate
  • 15012 replies
  • July 21, 2021

Hi @Spike all of the integrations we connect with would show the data outside the form, I’m afraid. I think Google Data Studio is the best option (see an example of how it looks here!), but we have other ones here, such as ReportGorilla. I haven’t personally used ReportGorilla, but there are other customers that like using it. :grinning:


  • Navigating the Land
  • 1 reply
  • February 16, 2022

Hi @john.desborough, I can work with variables on document studio to auto create the files, but how do you pass data generated charts from GSheets to Google Slides using Document Studio? 


Wow, I’m just exactly looking for the same feature,

Thanks @Sweendawg for creating this topic.


As it has been long time, I’m curious if any of you could suggest an approach that could help to generate radar chart and present at the end of the form.


Thanks In advance.


Liz
Community Team
Forum|alt.badge.img+5
  • Tech Community Advocate
  • 15012 replies
  • February 18, 2022

Hi @tejakummarikuntla nothing like meeting a fellow radar-graph fan!

We have a workaround here that might help you: 


Liz
Community Team
Forum|alt.badge.img+5
  • Tech Community Advocate
  • 15012 replies
  • February 24, 2022

Thanks, @Kevin at RSB ! Have you integrated the two products together to create a radar graph? 


I have not.  There’s a fee per report to use that product.  I ended up just using a work around by creating a scale people refer to on the end screen.

So far all the products I’ve seen that do that fancy stuff are all expensive.  The point of my form is a free lead magnet, so I don’t want to pay more than I have to. 

You can check mine out at:
https://www.relationalbootcamp.com/

mine launches fro the side.


Liz
Community Team
Forum|alt.badge.img+5
  • Tech Community Advocate
  • 15012 replies
  • February 25, 2022

@Kevin at RSB Do you mind if I try out your form? :grin:


By all means.  Let e know if you get the results page emailed to you.  It should work.  You can unsubscribe anytime after you test it if you desire. 


Liz
Community Team
Forum|alt.badge.img+5
  • Tech Community Advocate
  • 15012 replies
  • February 28, 2022

@Kevin at RSB I didn’t receive the radar graph, but I did receive the notification email! 


Liz
Community Team
Forum|alt.badge.img+5
  • Tech Community Advocate
  • 15012 replies
  • May 27, 2022

Hi @Sweendawg @tejakummarikuntla @Spike @Pedro Marzagao @john.desborough 

@picsoung shared a possible solution for you all here! It’s using another product, but it may come in handy for those of you that need a radar chart. 😀


  • Navigating the Land
  • 1 reply
  • June 16, 2023

QuestionPro has the feature… I’m going to try it out and if it works, I’ll subscribe and possibly switch over. 


Reply