Answered

Understanding averages for a small sample size survey

  • 14 January 2022
  • 3 replies
  • 152 views

Userlevel 1

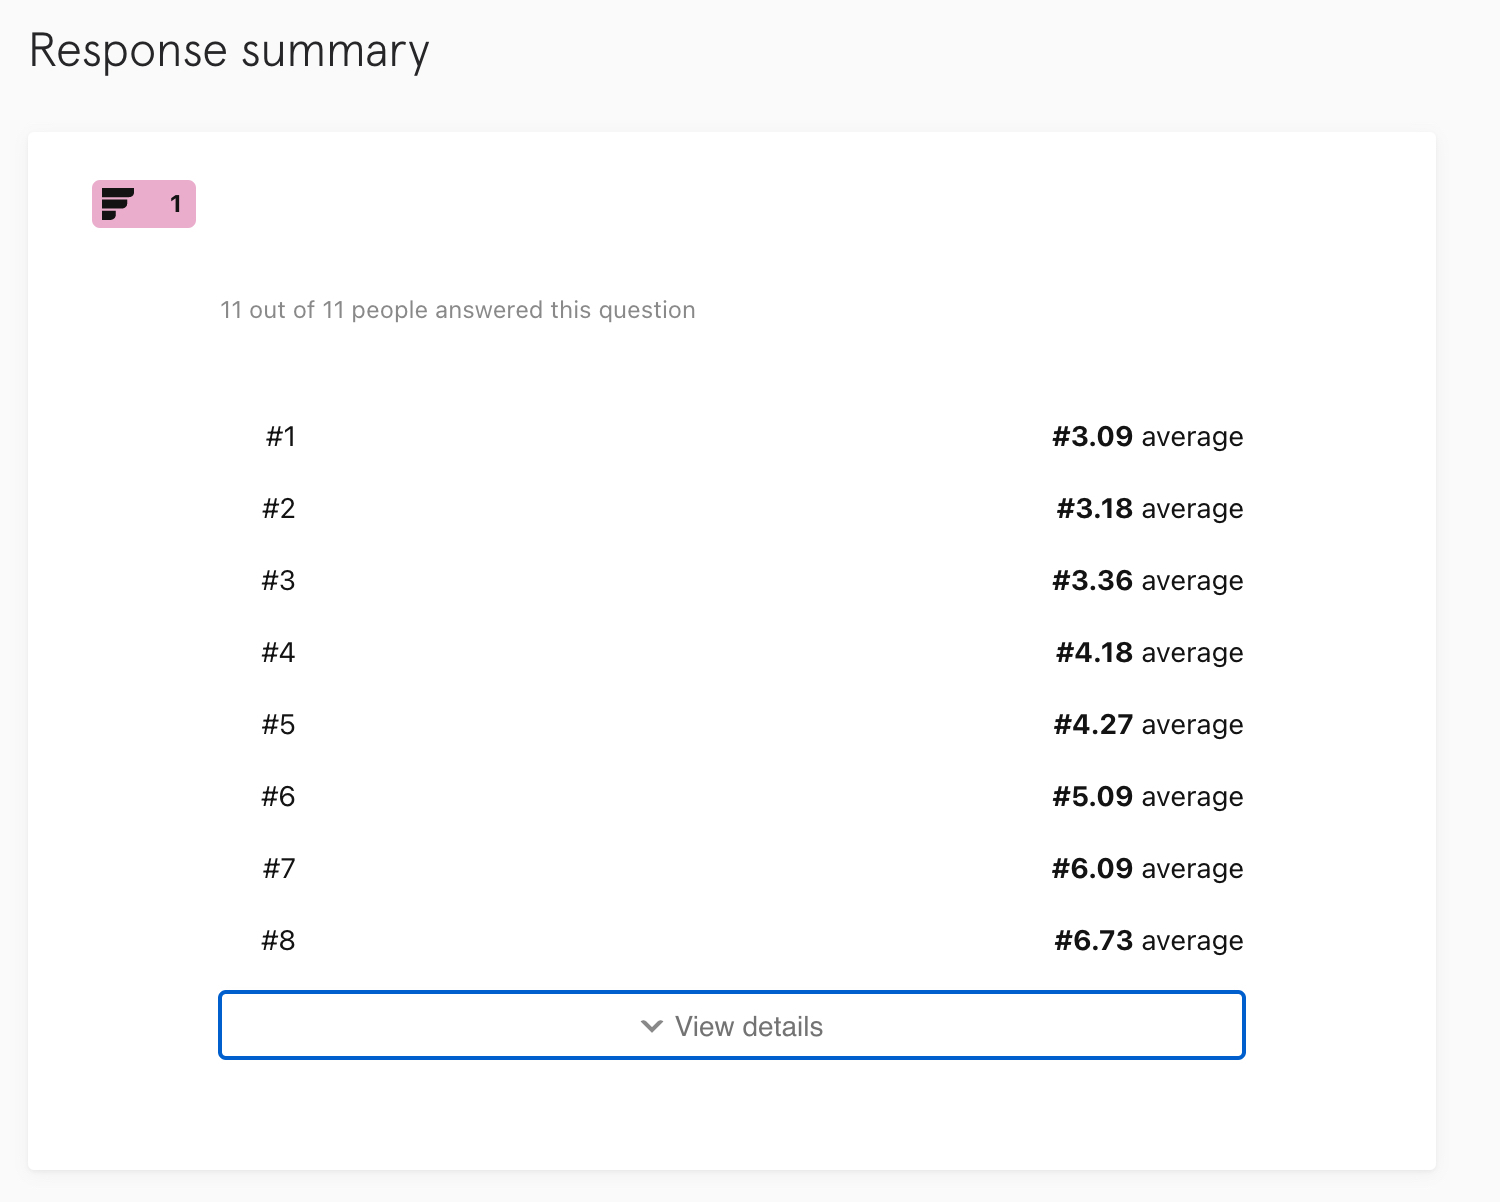
Hello! Hope you can help a newbie… I’ve asked survey participants to rank 8 items, and I can clearly see the results of the ranking 1-8 in the left column. I assume that this is the ranking score that I was after. The average is provided for each ranking on the right. The average starts smaller for the most highly ranked response, and grows larger towards the lowest ranked response. My naive question is this: what is the relationship between the ranking and the average? Also, when these values on the average are very close together, say for the #1 and #2 my instinct is to call these a tie for the ranking. Can you recommend a formula to declare the statistical significance (or not) of the spread?

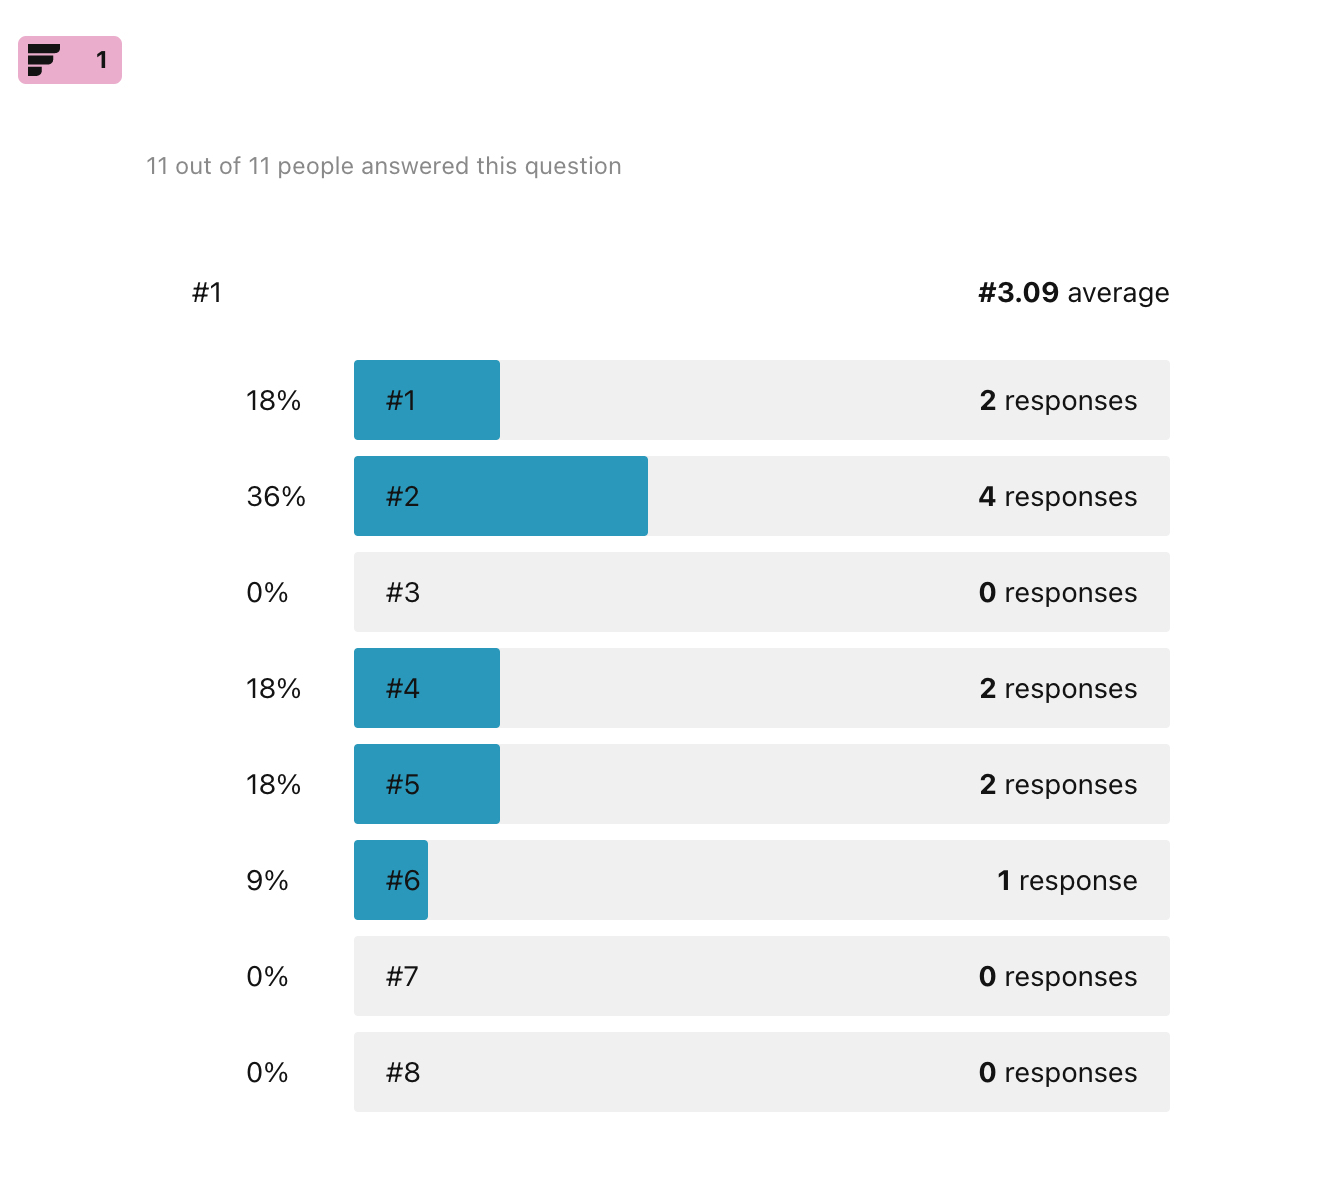
The individual results caused some confusion for me too. Here is a screen shot of the first response. Sorry in advance for the naive question (maybe a lack of coffee!) but what does this represent? Unlike najla’s example, my results don’t seem to support the ranking?

THANK YOU for helping me better understand these results.

B

icon

Best answer by Liz 18 January 2022, 17:46

View original

3 replies

Userlevel 7
Badge +5

Hi @brillbrill Welcome to the community! @john.desborough will be the first to tell you that you should definitely get a cup of coffee. Don’t deprive yourself!

Anyway, our article here has quite a bit of information about how the averages are calculated in the ranking question. 

I’m sadly not the best at math, so you wouldn’t want an equation for further calculations from me, but @john.desborough or @Paulo might be better at math than I am!

I would also recommend connecting to a third party, like Google Sheets, to automatically do the calculations you’re looking for. 

Userlevel 7
Badge +6

TBH @Liz - i don’t even bother with the Typeform native response figures in this case .. simply because i can’t figure out the algorithm in a fashion that the 7 other voices in my head can understand. I pull all this into Google Sheets and do me magic wand over the data there.. 

Userlevel 1

Thanks, John. the TM built-in approach to scoring Ranking was a real problem for our team. We started to think that the weighting scores should be flipped so that at least the % avgs are correlated to the highest rankings… still playing around with it but this is the direction we’re taking.

Reply