New feature

New! Get richer insights with Performance Trends

New! Get richer insights with Performance Trends
Userlevel 7
Badge +5
  • Tech Community Advocate
  • 12693 replies

It’s one thing to collect data, but it’s another to see how your respondents are answering over a given period of time. If you loved the Insights panel of the builder, you’re going to fancy it even more now with the newest update from our product team - the performance trends!


If you’re a visual person like me, seeing data in a chart makes it much easier to comprehend versus a full list of numbers. Thankfully, the product team developed the Performance Trends so you can have a better understanding of how your respondents are answering over a given period of time. 


How to use the new trends report


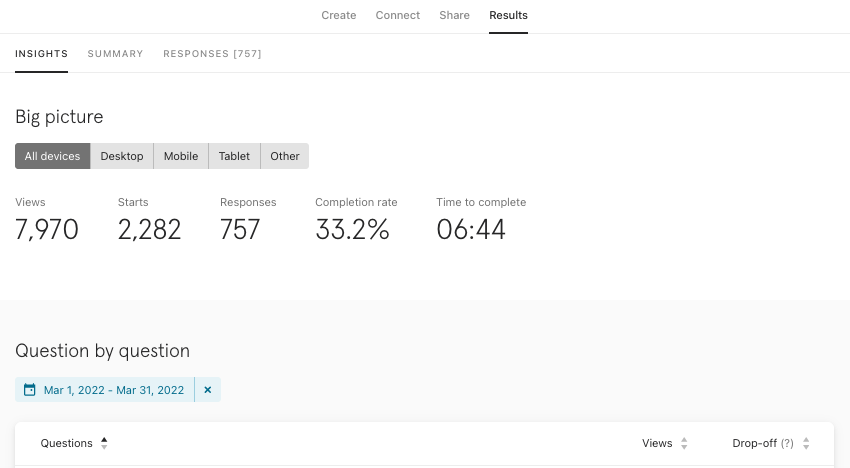
1. When you first land on the Insights page, you’ll see a lovely overview of the submission rate over time. 


2. If you want to see how many respondents answered over a given period of time, you can use the filters and selectors to narrow it down for your given timeframe. 


3. But it’s not just the submission rates you can view in the report! Take a peek into views, starts, completion rate, and time to complete as well. 


4. Our product team even gave the chart a little pizzazz by allowing you to scroll through the dates in case you don’t want to use the filters feature. 


Nothing like a little extra visuals to get a grasp on your data! How will you use the trend report? Any feature you’re most excited about? Let us know in the comments below!


18 replies

Userlevel 7
Badge +6

yay!… i like @Liz … tell the Product team that this is a winner already.. lol.. I am loving this.. 


Userlevel 6
Badge +2

thank you @Liz ,

this is the tool i need!!!

I would love to find help from someone that I can pay to help me create. This is easy, but it takes time to learn, make mistakes and create a form that works. Can you refer anyone? Thanks

Userlevel 7
Badge +6

@ServiceBookie - welcome to the community

there are a number of partner firms that you can find at this link. One of the firms there may be able to help you.. 


des

Userlevel 7
Badge +5

That's really cool, @Liz! Thanks for explanation! 

Tagging here some users that might find this interesting! 😉 @Paulo @Michaela @Darnell @talon256 @FPBB @JeanMcK 

Userlevel 7
Badge +6

Yaaaaay! I was literally playing around with this feature earlier today in a typeform I created and I was like “whoa, this is awesome”. Great job on always working towards improving the user experience! 👏👏👏

Userlevel 2
Badge

Thanks for this, had spotted the features and find it interesting for sure :)

Thanks for the link in, always on the look out for new learning!

Jean

Userlevel 7
Badge +5

Any specific feedback you have about this, @Michaela and @JeanMcK😊

Userlevel 2
Badge

Hiya, yes 3 key things

  1. I like the title - grabs your attention
  2. Step by step guide VERY effective to explain
  3. Visual far outweighs a written version of what you are showing.

Thumbs up from me,

Jean

Userlevel 7
Badge +5

Amazing, @JeanMcK! I hope you use the trend report as soon as possible and that it's helpful to you! Let us know if you do, OK? Wishing you a great day! 😊

Userlevel 1

Anyone know why it is not available on all surveys?

Userlevel 7
Badge +5

Hi @Sammyg The trend chart will only be available to customers who have the plan Business and Enterprise. If you happen to be working in multiple organizations, but only a few are on these plans, you aren’t going to see the report on the accounts that are not on these plans. 

Userlevel 1

Thanks Liz, confirm i have Enterprise so unsure if it was an earlier form built is a reason not having the insights. Ive tried to look for a setting to no avail. What i have seen is some reports in my list dont indicate they have analysis available...see screenshot...help is great appreciated….cheers


Userlevel 7
Badge +5

Hi @Sammyg Have you tried clicking into the forms directly and then going to the Results panel? 

Userlevel 1

Hi Liz, yes tried that to no avail the form in that section has no analytics?

Any other ideas or is this a bug?

Cheers

Userlevel 7
Badge +5

@Sammyg Could you send a screenshot of what you’re seeing in the Results panel? 

Userlevel 1

Sure thing Liz, see below...its missing the section where the graph would be like in more recent surveys...im wondering if it has something to do with versioning perhaps?


Userlevel 2

@Sammyg only forms which were created after July 22nd 2021 have access to global date filters and the trend chart. This is because these forms are running on a newer technology stack. We are planning on migrating older forms to this new stack as well, and thereby have access to filters + trends, but it will take some months to complete.

Do you know when the form in question was created?

Reply