Hi - I understand that Typeform cannot combine all multiple choice answers into one cell while exporting. However, do you have any recommendations on how to manipulate the data once it is in Excel so that I can connect the right questions with the answers? Right now, it just looks like a big mess of data without any logic to it at all.

Answered
Multiple Choice Answers Exported in CSV
Best answer by john.desborough
question: are you talking about extracting the report from the Results tab? or through a Connect integration with the spreadsheet? if you do this from the Results tab, follow the instructions below to map the results to a second tab
I use Google Sheets primarily these days for the connection to Typeform BUT the functions in Excel will work pretty much the same (don’t quote me on that lol)
question: have you published and distributed the survey to folks to complete? or are you still in testing mode? (if in testing it is easier to make this work but i will try to make it consistent either way)
steps - at least these are the steps that i had to go through:
- take out the proverbial paper and pencil and write out the mapping between question numbers and answer options and what column the response showed up in.
- this is much easier if your response choices vary from question to question.. ie
- q1 responses = chocolate, vanilla, cherry, licorice
- q2 responses = dark, milk, white, orange
- in the scenario just listed with distinct responses to all questions (so that you could identify the question number), you would simply go to the spreadsheet and make a note that q1 chocolate is column c, q1 vanilla is column d, etc.
- if you have something where you are talking about your cereals and you have identical responses for each question ie
- how often do you eat oatmeal: never, daily, couple times a week, once a week?
- how often do you eat cornflakes: never, daily, couple times a week, once a week?
- this last one is the tougher to do .. easiest way to “test”it is to edit the typeform and leave q1 as required and the rest optional - then respond and see which column(s) the q1 responses are being written into. then make only q2 required and do the same thing… until you have the mapping.
- it took me about 2 hours to do this on the 47 question typeform
- this is much easier if your response choices vary from question to question.. ie
- once you have that mapping then you can do the following to make it easier on you to review the data
- create a second tab (I call mine ‘reporting’)- we will use this to pull the data in, in the order that we want and make it easier to identify questions and responses and look for ways to reort
- note I do this in Google Sheets so i will walk you through the process - you can extrapolate to Excel fairly easily
- create column headers on the second tab that go something like this (i am using example of 4 choices per question)
- q1a, q1b, q1c, q1d, q2a, q2b, q2c… etc - this will give you the questions and the response columns in order - you could use q1-chocolate, q1-vanilla, etc.. if you wanted to have a more visual clue but that is your choice
- make it easy on yourself - you don’t have to use the full question name for the header in your reporting tab
- using the arrayformula() function in Google Sheet, in the first data row (typically row 2) i create the formula to go look on the first tab (where typeform has deposited the data) and pull the data back into the cell that is appropriate for that question
- assumptions: A2 is where i want to place the q1a response and on the main tab that has been mapped to column R
- formula to pull data =arrayformula(name_of_first_tab!R2:R)
- that is entered into cell A2 and will look into the first tab and pull ALL the elements in column R, starting at R2 and going down till there are no more entries to pull
- enter a similar formula into all the cells of row 2 to pull the data into the appropriate order
- if you want to get fancy and do lookups to yet another tab and pull in data based on where an average score might rank you, you can do the same thing with the arrayformula() function and insert the appropriate IF statements and comparison values (ie if less than 5 grab cell d2 from tab3, if gte5 but less than 10 grab cell d3 from tab3, etc)
- create a second tab (I call mine ‘reporting’)- we will use this to pull the data in, in the order that we want and make it easier to identify questions and responses and look for ways to reort
i know that seems like a really painful way to do it if you already have data in the typeform responses. but it does work.
It would be so much easier to simply Connect the typeform to a Google Sheet and have the data pushed there directly to do the analysis … the image below is what was pushed to the Sheet from a quick test form:
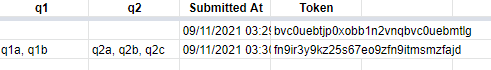
note that there were a,b and c choices for each of q1 and q2 and i turned on multiple select. The selected responses show up in the column in comma separated format. You would have to parse the field out to get the individual responses but you can see the data is there fairly easily
now if that all sounds like i am rambling .. i probably am.. but i hope that helps to explain


Enter your E-mail address. We'll send you an e-mail with instructions to reset your password.