Hello Typeform Community! I have struggled to understand the set-up flow the questionnaire where certain questions are scored under separate topic. Since the questions answers will also be evaluated in separate categories and divided by the number of questions in the category. To make it clearer I will add the information and background of the questionnaire.
The questionnaire I like to set up is Emotion Regulation Questionnaire (ERQ) where there is 10 questions.
Items 1, 3, 5, 7, 8, 10 make up the Cognitive Reappraisal facet.
Items 2, 4, 6, 9 make up the Expressive Suppression facet.
Each facet’s scoring is kept separate.
The ERQ each item is rated on a 7-point Likert scale from 1 (strongly disagree) to 7 (strongly agree).
Cognitive Reappraisal Score: Sum the scores of the 6 reappraisal items and then calculate the average (sum of the 6 items divided by 6).
Expressive Suppression Score: Sum the scores of the 4 suppression items and then calculate the average (sum of the 4 items divided by 4).
Example of the question is: When I want to feel more positive emotion (such as joy or amusement), I change what I’m thinking about. Scoring: *strongly disagree - 1; *disagree - 2; *mostly disagree - 3; *neutral - 4; *somewhat agree - 5; *agree - 6; *strongly agree - 7.
I would highly appreciate some examples in form of pictures how to set up the logic and answers with scores. 🙏🏻🙏🏻🙏🏻
Best answer by makelearning
HI @Britta Burket I did a similar type quiz years ago and I found the best way to do it at that time is to connect the results with a spreadsheet, such as Google Sheets, Excel Online, or even Notion or Airtable. I’ve included a basic overview below of how I did this with pictures. If any step is unclear or you have questions, let me know. I believe the Typeform support team help me set it up this way about 7 years ago, not sure if there’s a better way or functionality to do it within Typeform now.
For the Survey
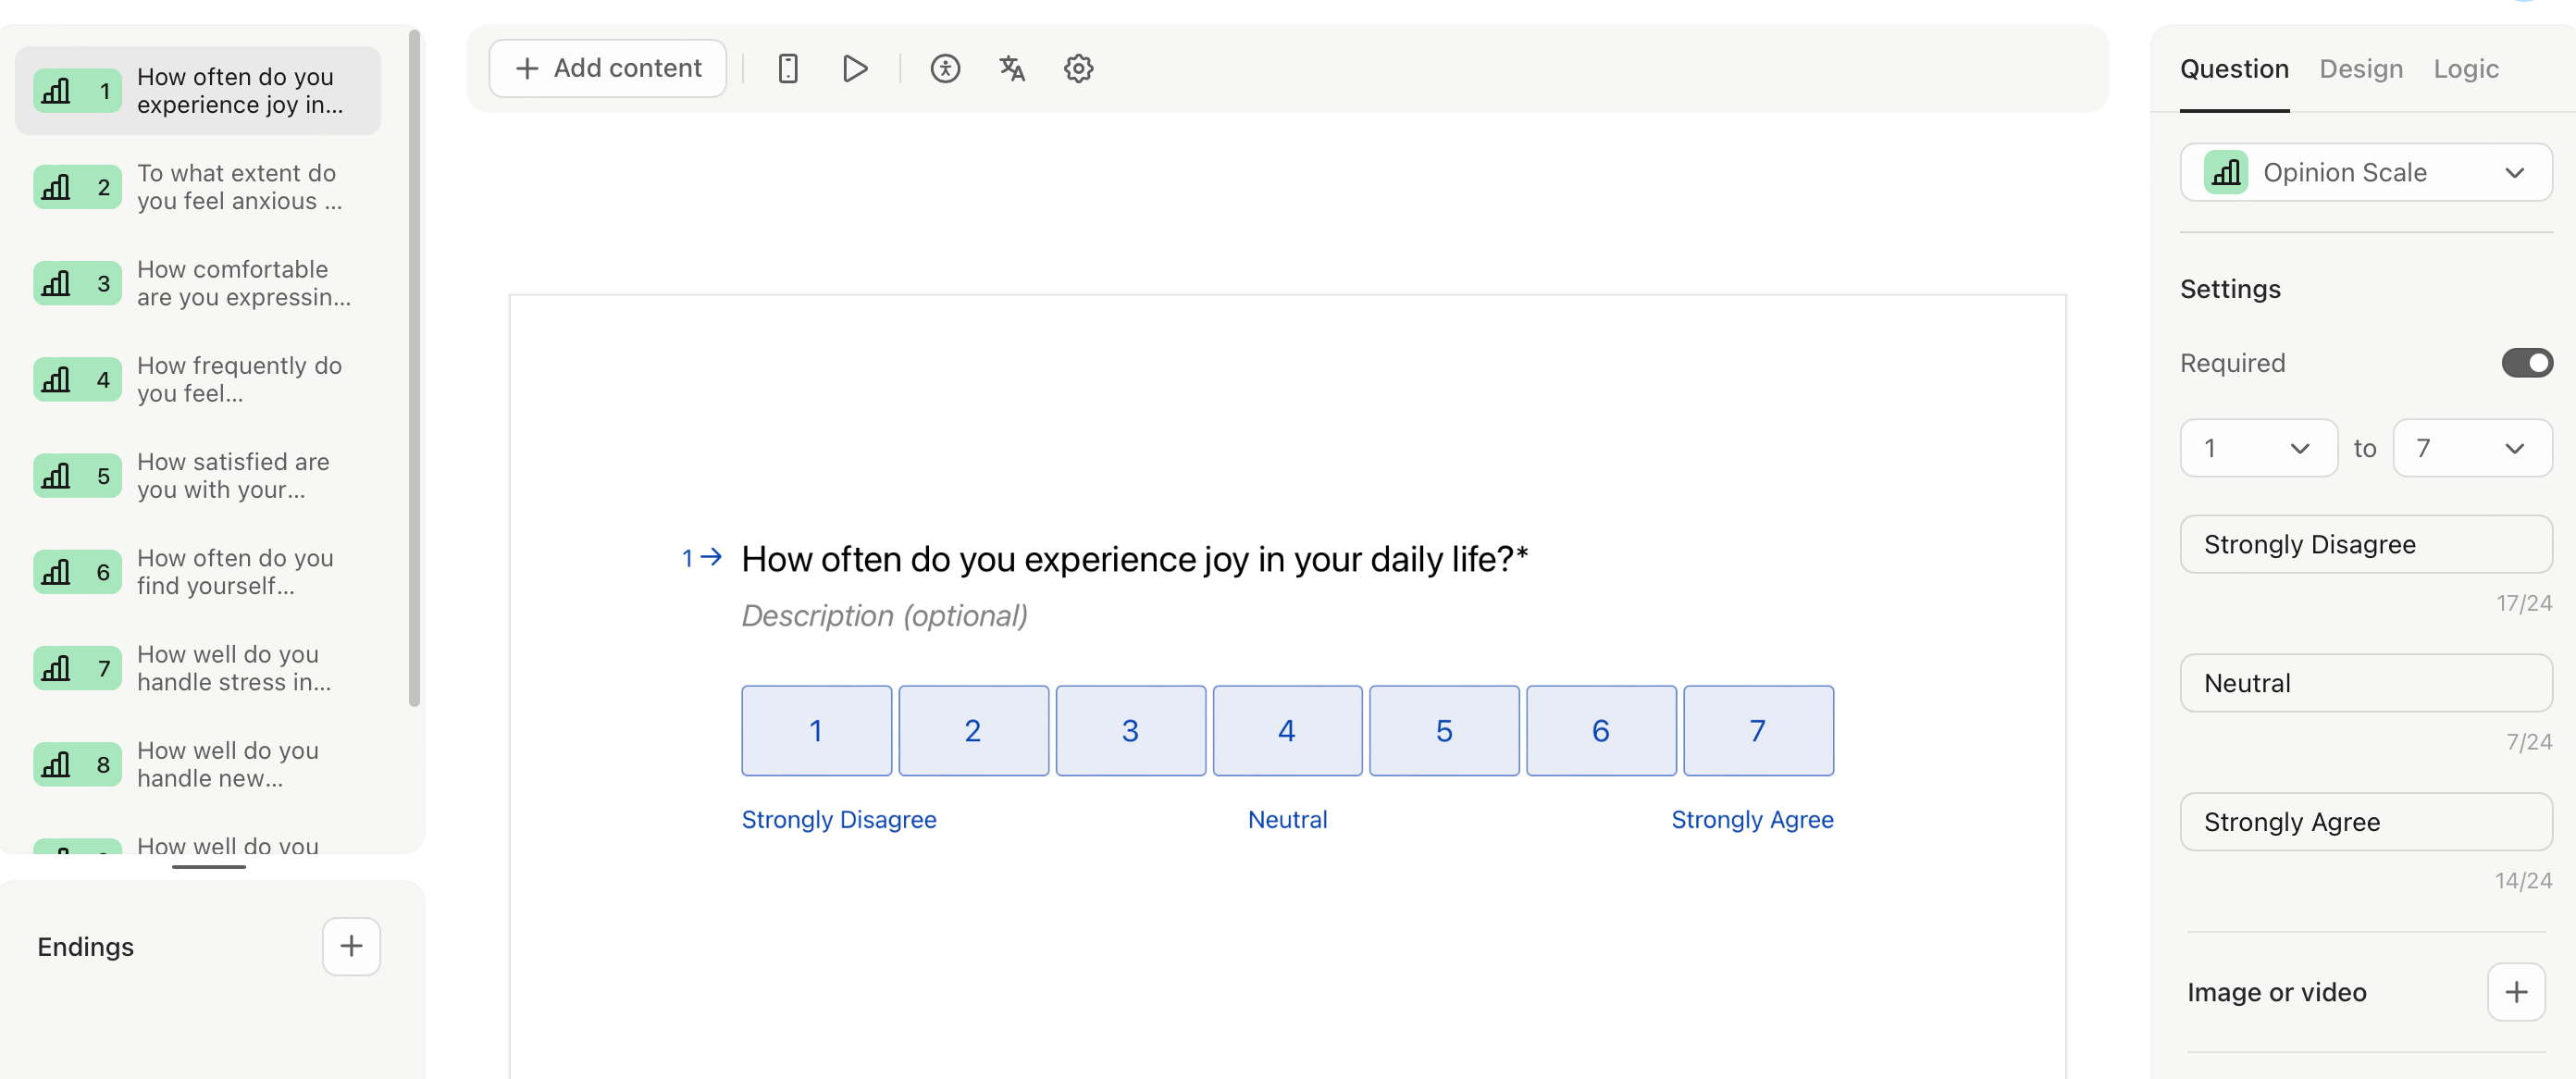
I used the opinion scale 1-7. I created this with AI and you can too by just telling the AI to create a 10-question quiz with a likert scale with 7 options. It didn’t get it perfect, but it saved time and I can just tweak the question text and settings. Here’s an example of that:
Connect Your Spreadsheet/Database Software
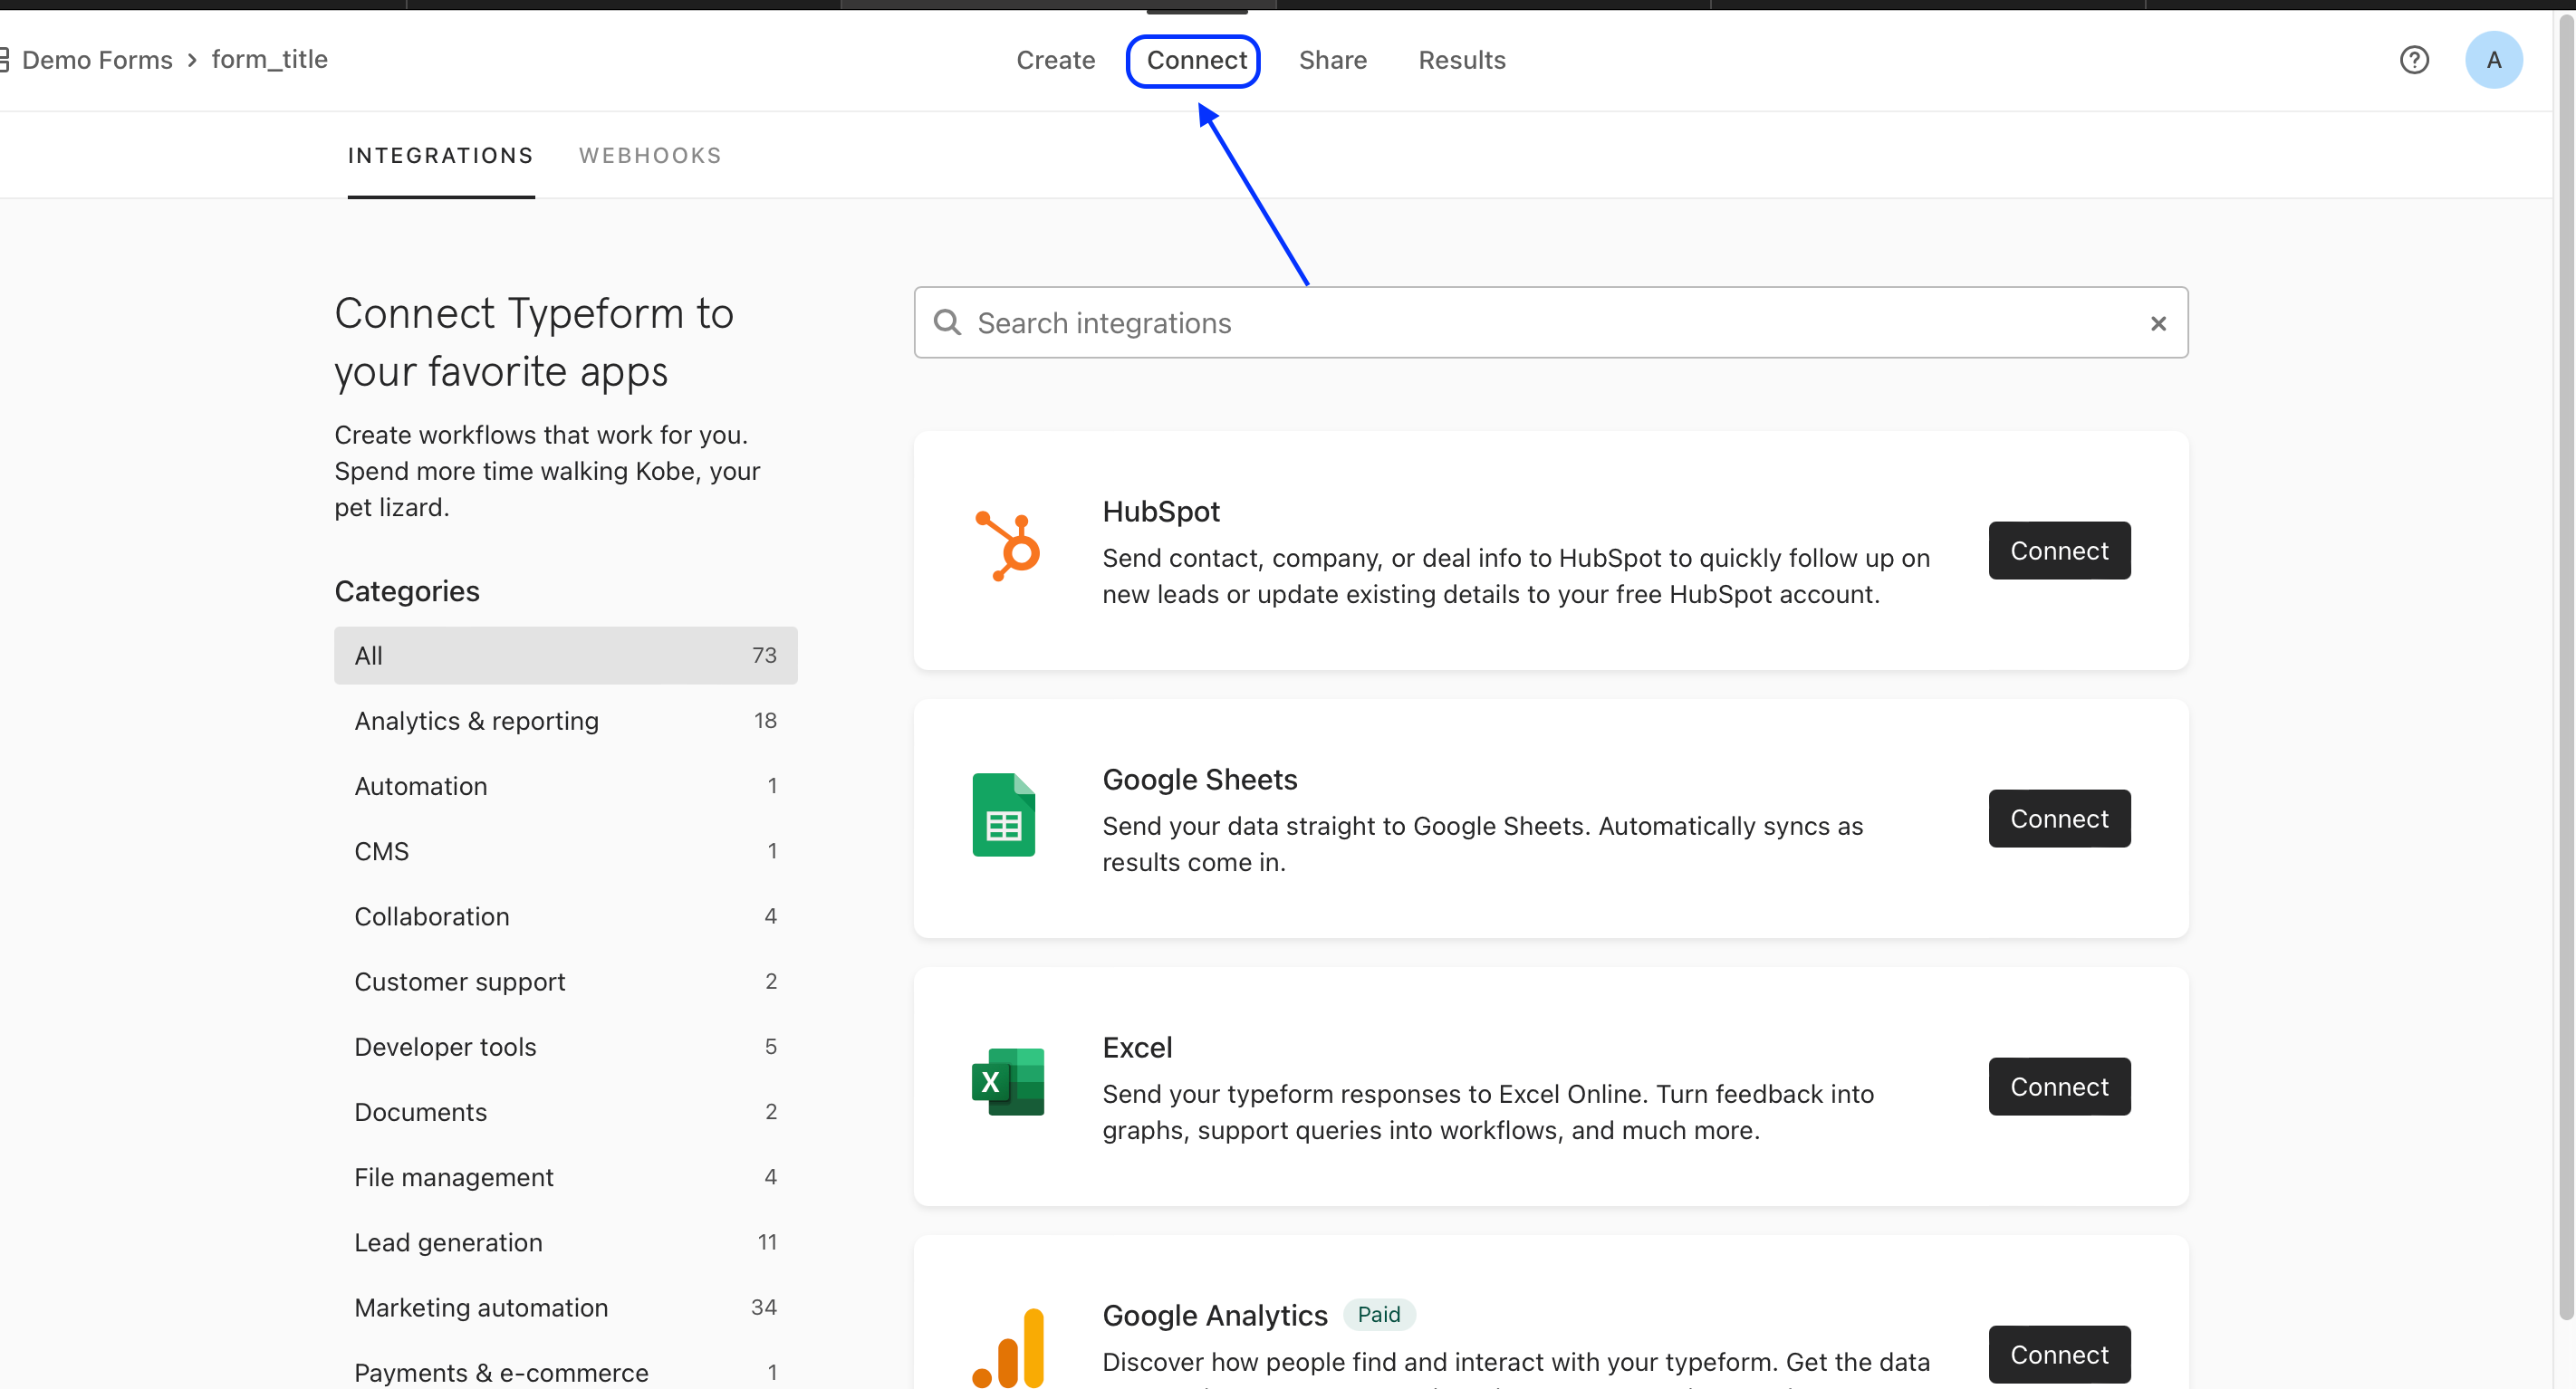
Next, go up top and select the connect tab. Scroll through the list and select your preferred spreadsheet or database software. You’ll first authenticate with typeform and then it will ask you for the login information of the service/software you are connecting. Lastly, you’ll need to create a new spreadsheet or database and provide the name in Typeform—sometimes this option tells you to select from a dropdown. For this example, I am using Notion, which is also a free service you can sign up with.
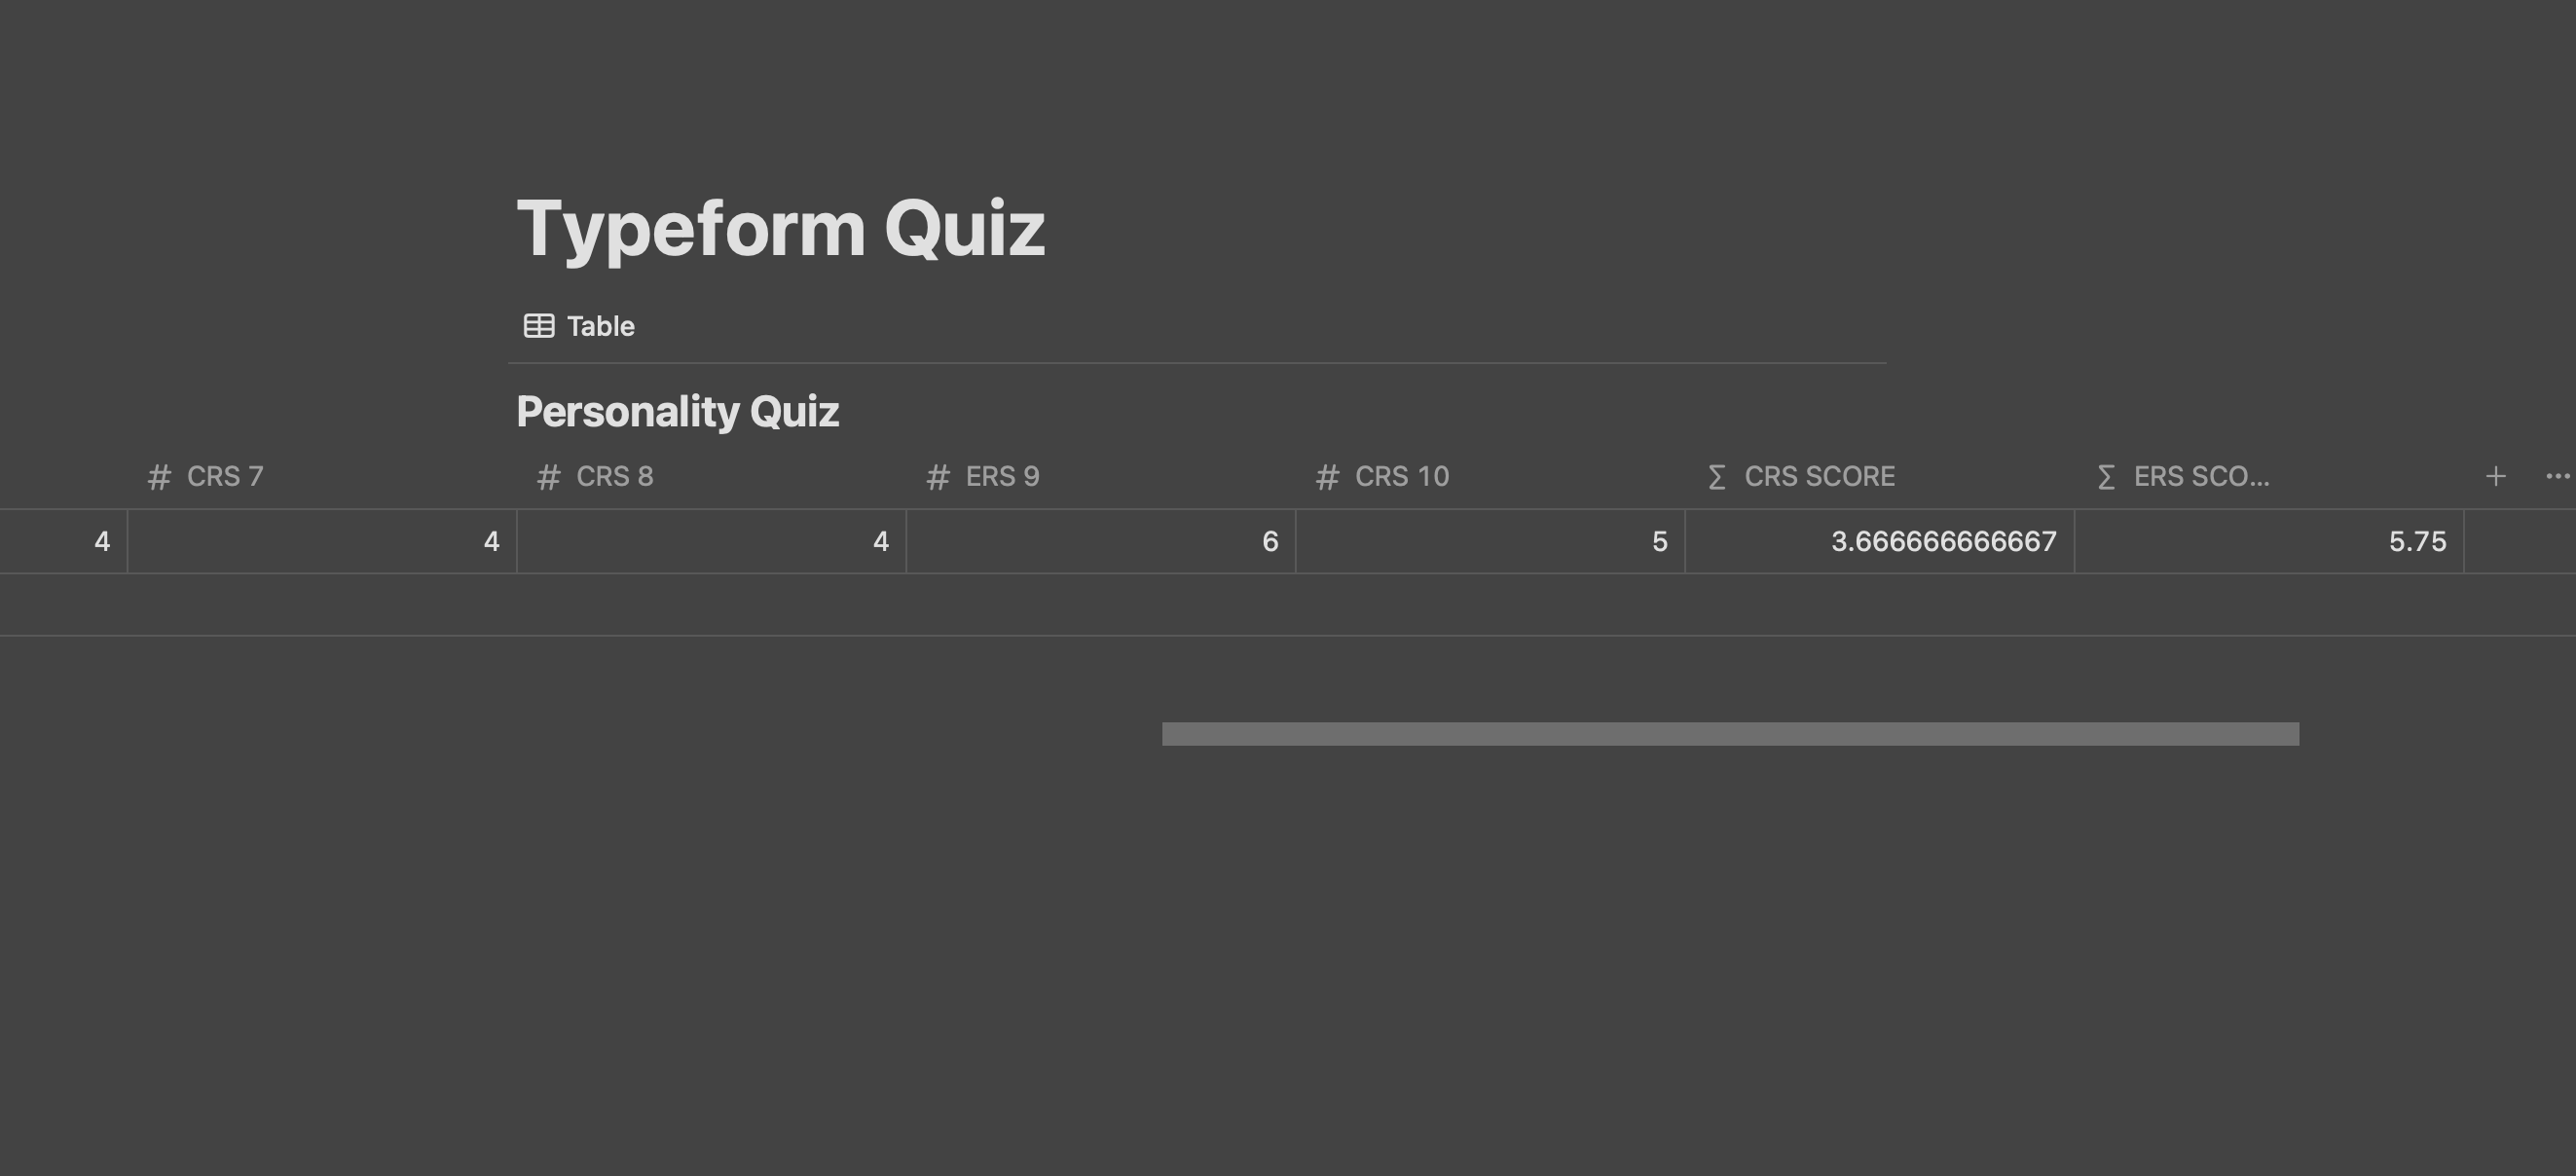
Next, Format Your Spreadsheet/Database
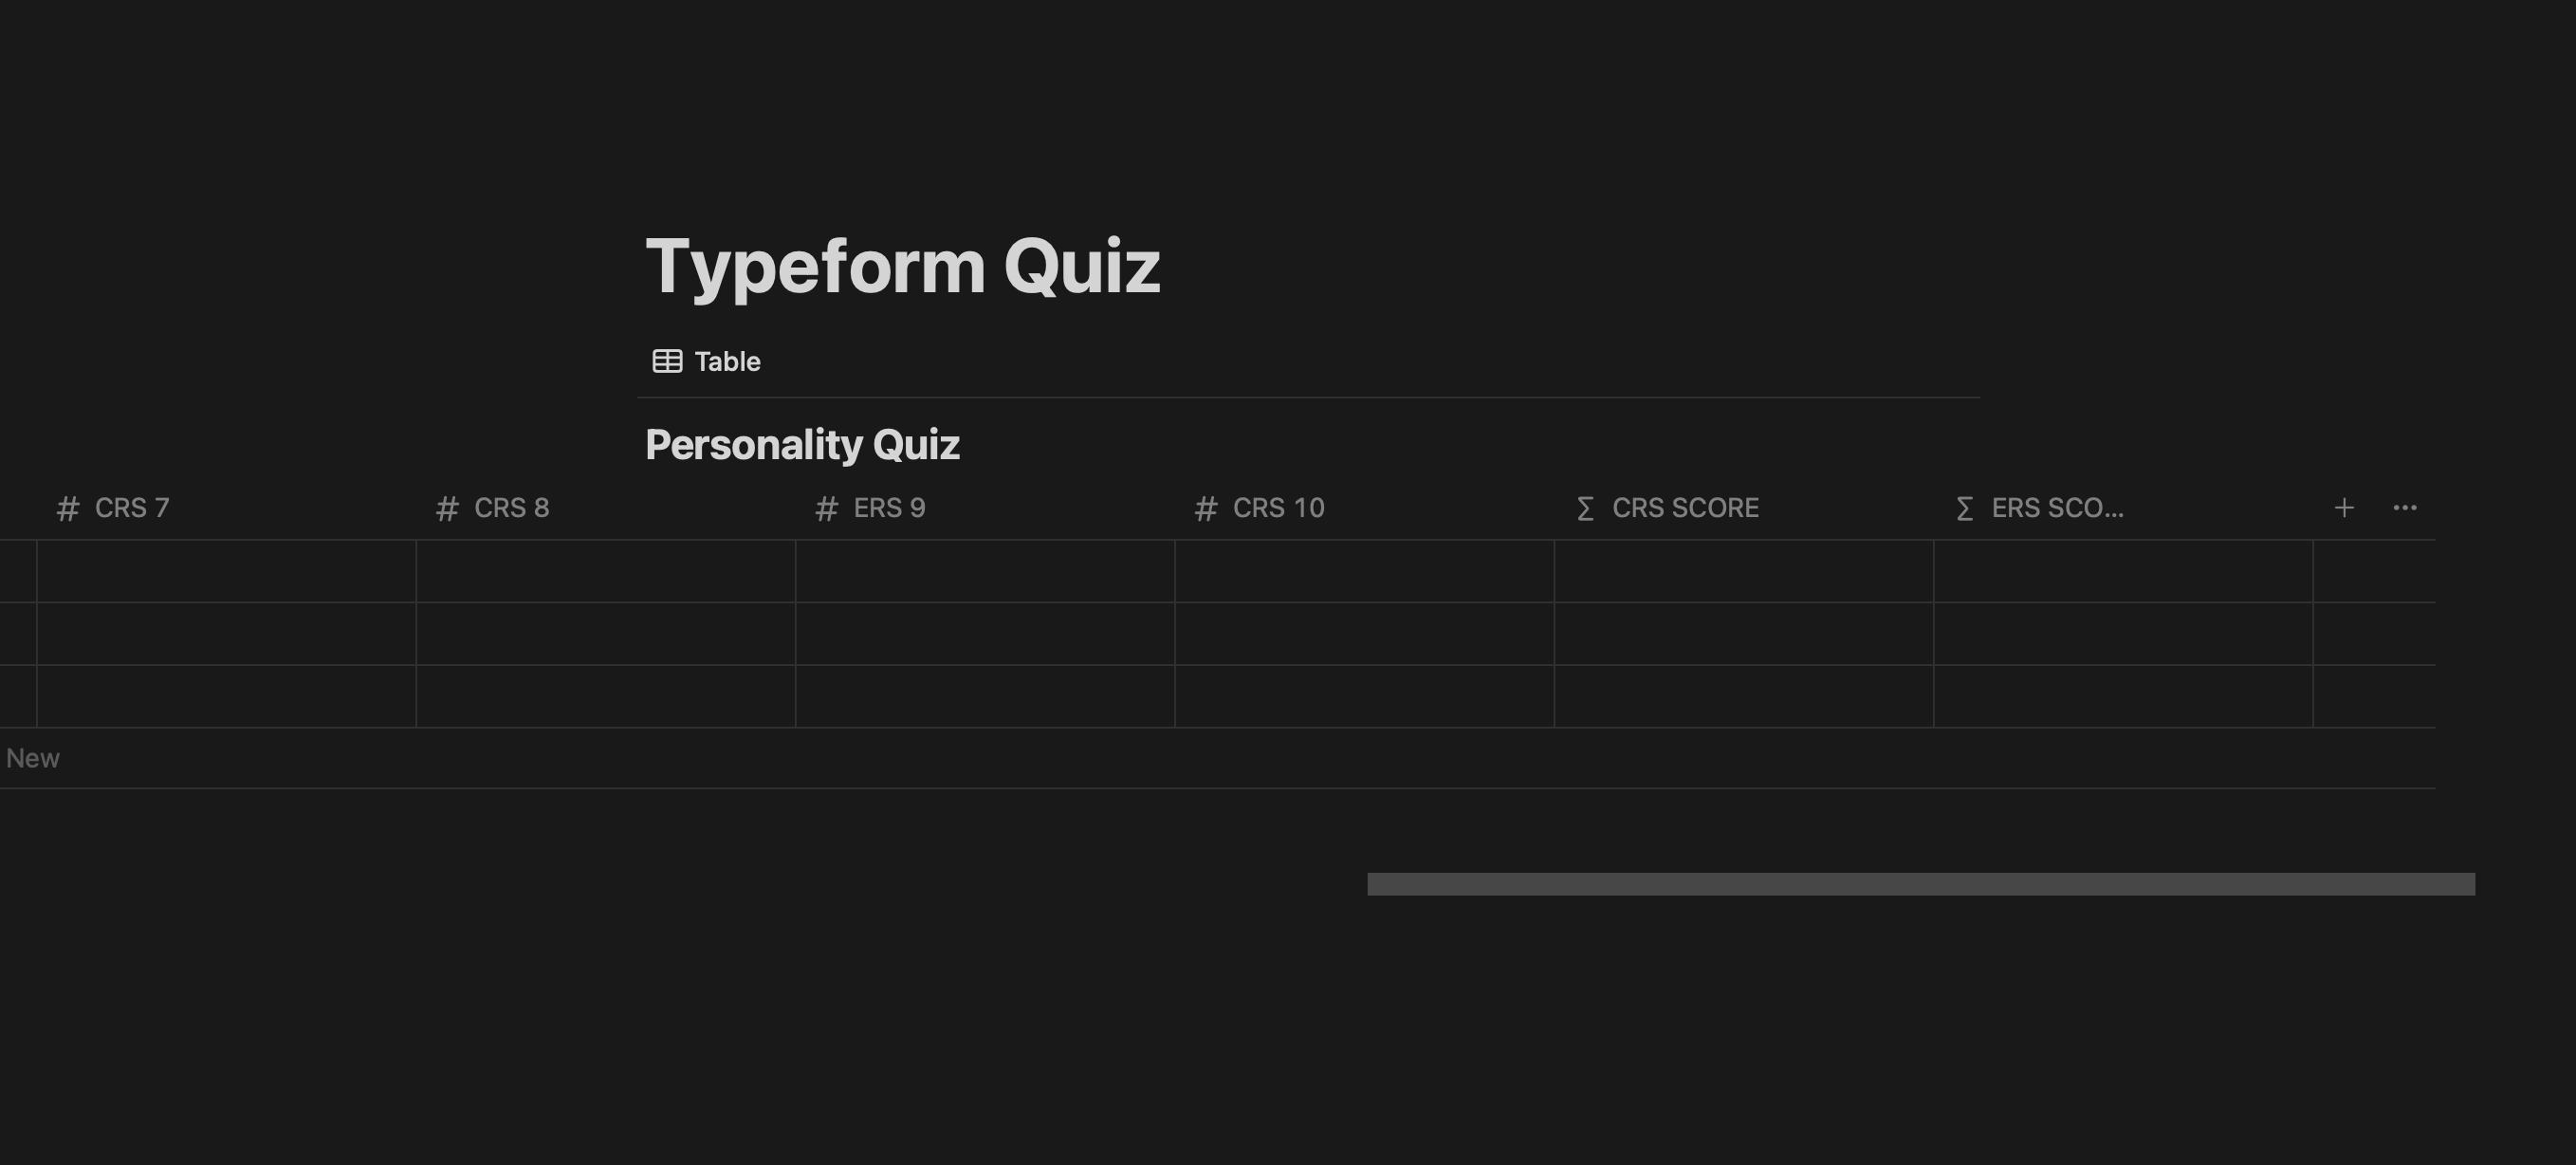
Next, you’ll need to format your database by naming each column across the top to correspond to every value in the survey. For example, you’ll need at least 10 columns, one for each answer of your survey. You may also need an additional field for the name or email or other data you collect from participants. In this case, I’ve used Notion and labeled each question as you described above. For example CRS 1 is question 1 and corresponds to the Cognitive Reappraisal Score. At the end of your spreadsheet or database add two columns, one for the total CRS Score and one for the total ERS score. You will add a formula to calculate the CRS score and the ERS Score. How you do it depends on what software you are using. See in the screenshot below, the last two columns are variables. You can also add your formula after getting the first result, which is what I did to make it easier to calculate.
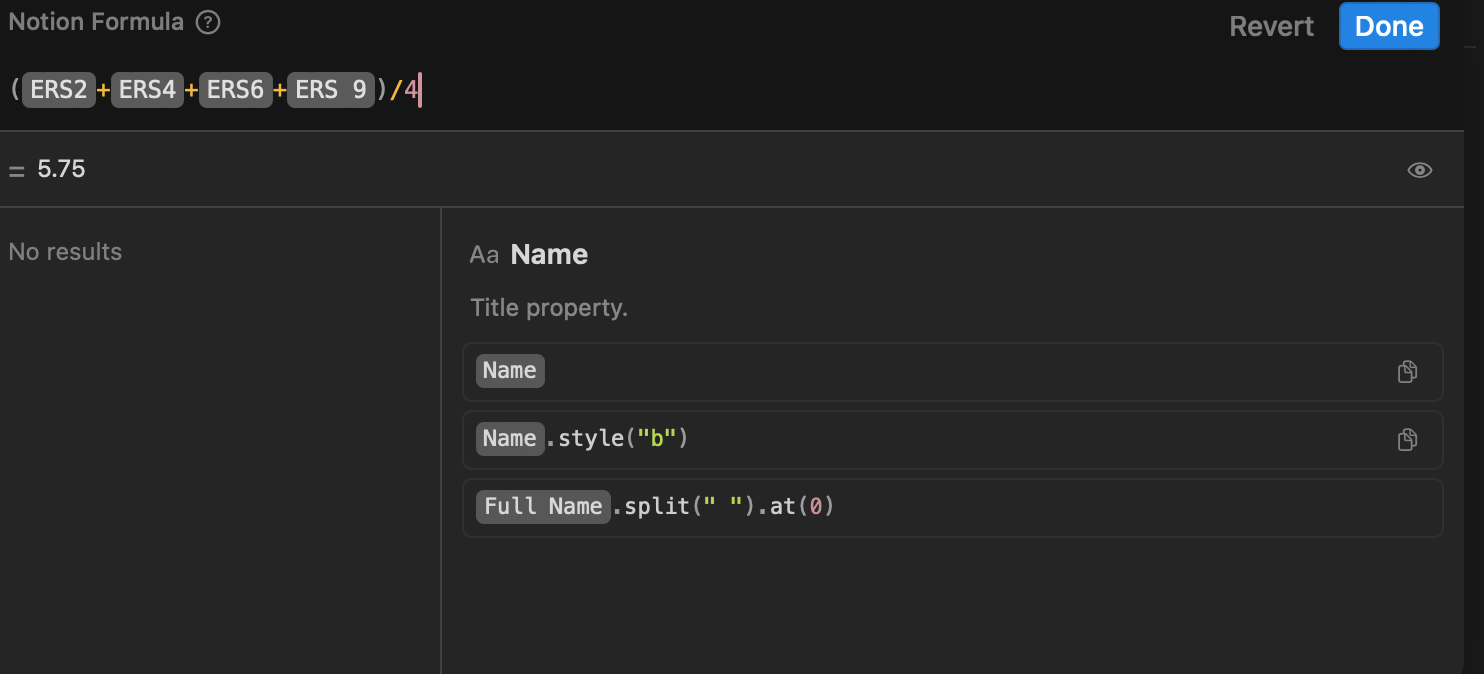
Example formula for ERS Score in Notion
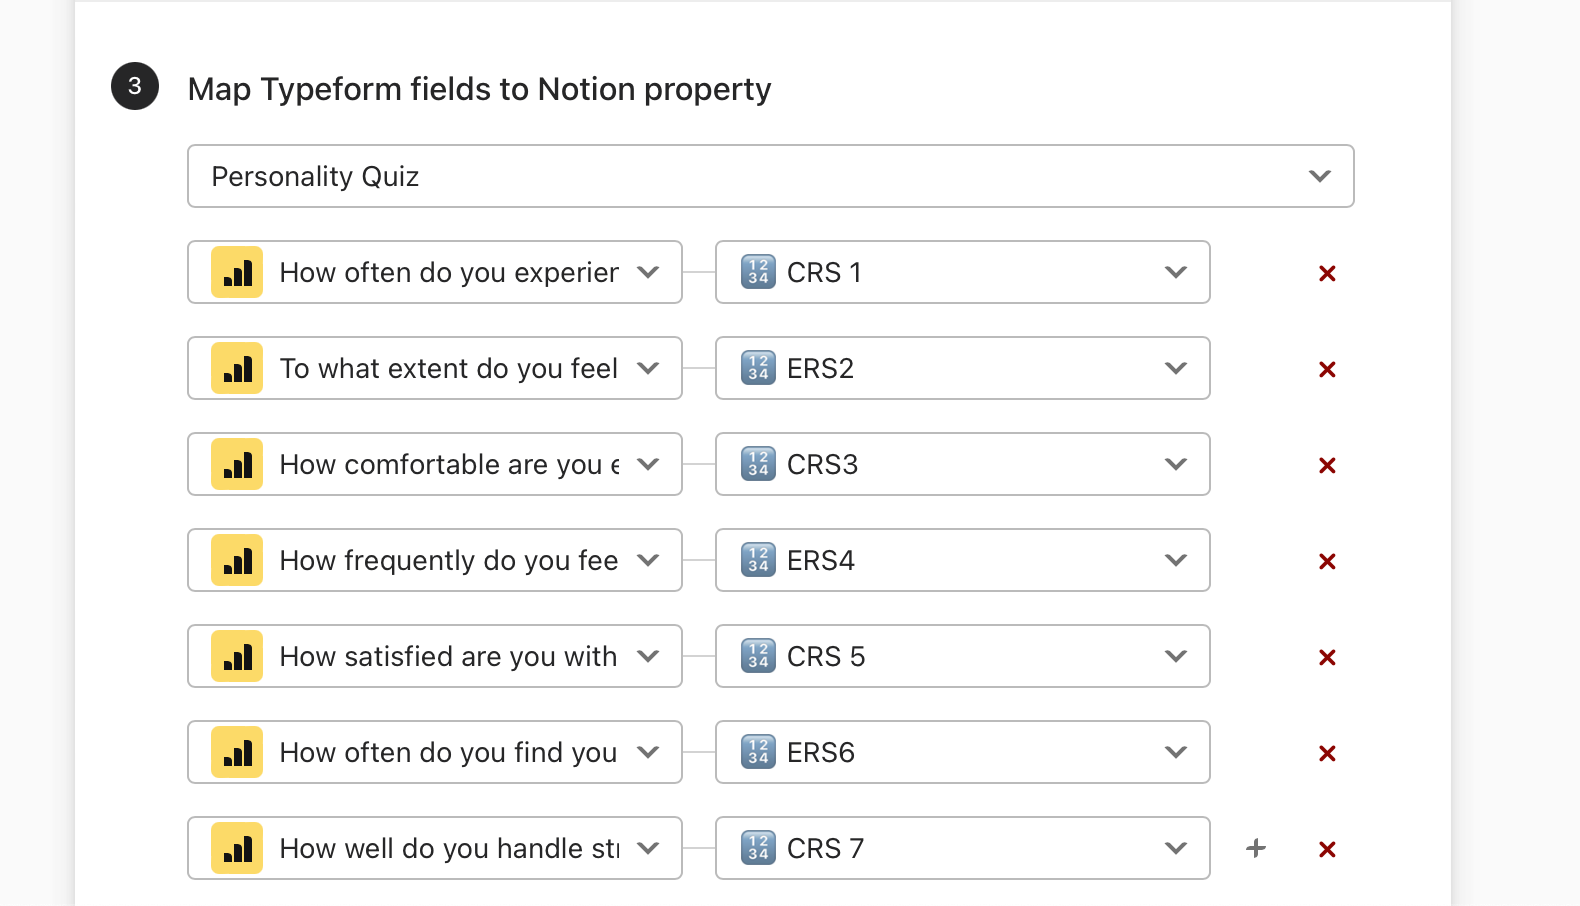
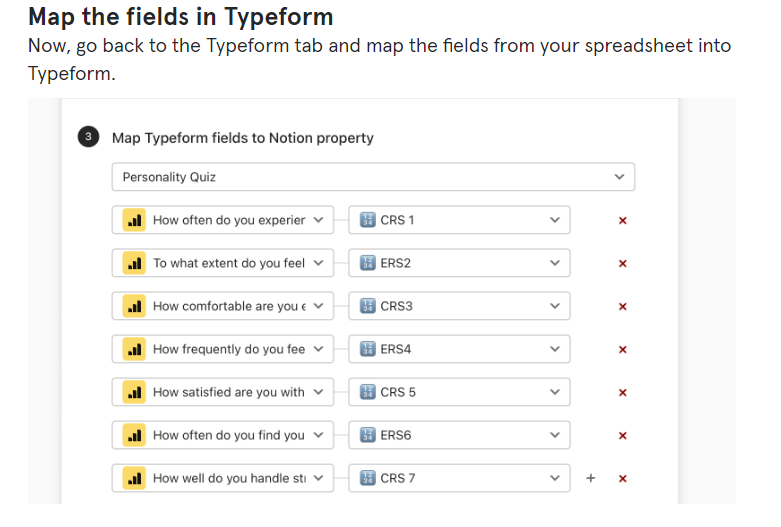
Map the fields in Typeform
Now, go back to the Typeform tab and map the fields from your spreadsheet into Typeform.
Share and Get Results
Now, when you are done connecting share the quiz and get results! Typeform will populate the question fields, and then the last two columns will populate with the scores. Note: you may need to copy and paste the formulas down the spreadsheet as new results are added.
Does this seem like it works for you? Please let me know if you have questions :). I didn’t go into too much detail, but if you share what software you plan to use to integrate, I can provide more advice.
HI @Britta Burket I did a similar type quiz years ago and I found the best way to do it at that time is to connect the results with a spreadsheet, such as Google Sheets, Excel Online, or even Notion or Airtable. I’ve included a basic overview below of how I did this with pictures. If any step is unclear or you have questions, let me know. I believe the Typeform support team help me set it up this way about 7 years ago, not sure if there’s a better way or functionality to do it within Typeform now.
For the Survey
I used the opinion scale 1-7. I created this with AI and you can too by just telling the AI to create a 10-question quiz with a likert scale with 7 options. It didn’t get it perfect, but it saved time and I can just tweak the question text and settings. Here’s an example of that:
Connect Your Spreadsheet/Database Software
Next, go up top and select the connect tab. Scroll through the list and select your preferred spreadsheet or database software. You’ll first authenticate with typeform and then it will ask you for the login information of the service/software you are connecting. Lastly, you’ll need to create a new spreadsheet or database and provide the name in Typeform—sometimes this option tells you to select from a dropdown. For this example, I am using Notion, which is also a free service you can sign up with.
Next, Format Your Spreadsheet/Database
Next, you’ll need to format your database by naming each column across the top to correspond to every value in the survey. For example, you’ll need at least 10 columns, one for each answer of your survey. You may also need an additional field for the name or email or other data you collect from participants. In this case, I’ve used Notion and labeled each question as you described above. For example CRS 1 is question 1 and corresponds to the Cognitive Reappraisal Score. At the end of your spreadsheet or database add two columns, one for the total CRS Score and one for the total ERS score. You will add a formula to calculate the CRS score and the ERS Score. How you do it depends on what software you are using. See in the screenshot below, the last two columns are variables. You can also add your formula after getting the first result, which is what I did to make it easier to calculate.
Example formula for ERS Score in Notion
Map the fields in Typeform
Now, go back to the Typeform tab and map the fields from your spreadsheet into Typeform.
Share and Get Results
Now, when you are done connecting share the quiz and get results! Typeform will populate the question fields, and then the last two columns will populate with the scores. Note: you may need to copy and paste the formulas down the spreadsheet as new results are added.
Does this seem like it works for you? Please let me know if you have questions :). I didn’t go into too much detail, but if you share what software you plan to use to integrate, I can provide more advice.
Thank you very much for the replay and it seems doable. Did yo also were able to show the results to the test taker? Ideally, I would like not only collect data, but be able to present it to the test taker for example in the test ending sheet or even better on another landing page.
Hi @Britta Burket Glad it seems doable! So, I was able to show the results to the test taker by sending them an email with Zapier. Zapier is a software that connects other software programs. The specific feature I used is send participants an email when a new spreadsheet row is created, which you can find examples here using Google Sheets:
Typeform sends quiz info to spreadsheet or database
When Typeform data is added to database or spreadsheet it triggers an email to user
You can draft and personalize the email in Zapier with the user’s name, and you can customize what you’ll send them. Don’t forget to collect their email in the quiz.
As for showing the results to the user within Typeform, I am not sure because I have always done it this way I described to you, but maybe it’s possible🤓. I would check with Typeform support team.
When you say on another landing page, do you mean a website? Maybe it’s possible too… I would definitely check in Zapier as they have some connection capabilities with Squarespace, WordPress and other sites.
@makelearning I started with following the steps described and everything went smooth until part where is described mapping. Namely, when I open the Logic section and go through the options there, then I do not see anything similar as on this picture.
Under the connect I can see the sheet itself and option to delete it.
I used Google spreadsheet.
Or is it something I should turn to Typform support?
@Britta Burket - if you used Google Sheets for the integration you won’t see the mapping screen. Once you publish your typeform and put in a sample/test response you will see the data in the Google sheet in the columns named as per your questions.
Hi @makelearning! Thank you for getting back to me and I hope you had great vacation! 😀
I managed to connect the questionnaire with my Google spreadsheet and it is correct.
I managed to test that the results are coming automatically into Google spreadsheet although in different order than in Typeform quiz. I have managed to set up the calculations for the sharing with test takers.
Where I got stuck now is the e-mail sending part. How to I set it up in a way that right person get’s the right answers? I have previously used Mailchimp for collecting e-mail addresses for newsletter purpose, but not in a manner that the answer should get to the test taker with correct data and some explanation what to read out of the questionnaire.
I do see that Zapier has the specific fields for the text, but I have not yet understood how can I use any other e-mail than gmail.
@Britta Burket - you can use an add-in for Google Sheets called Document Studio (it’s about 100 USD for the year) that will allow you to merge the data record as it arrives in Google Sheet with an output template (Doc or Slides), generate a pdf and attach it to an email that it will send out via Gmail, etc.
there are several posts in here, including a webinar on how to do this, that can show you how.
alternatively, you can use some scripting inside Google Sheets to send directly via gmail - tbh, i have used the Document Studio version for my own reports and for many of my clients’ reports and it is the easiest thing to do
I did look into the Google Document Studio, but since I do not want to send out the results from my personal gmail account, then I most probably can’t use it.
@makelearning - I did set up the zap in Zapier, but I’m unable to understand why it says that there is no data
I did myself the test and therefore there is record and data
Hi @Britta Burket Sorry you experiencing so much trouble with this!
Thank you for the screenshot.
It looks Zapier is not seeing the data in your spreadsheet. I would try to refresh the spreadsheet in Zap trigger.
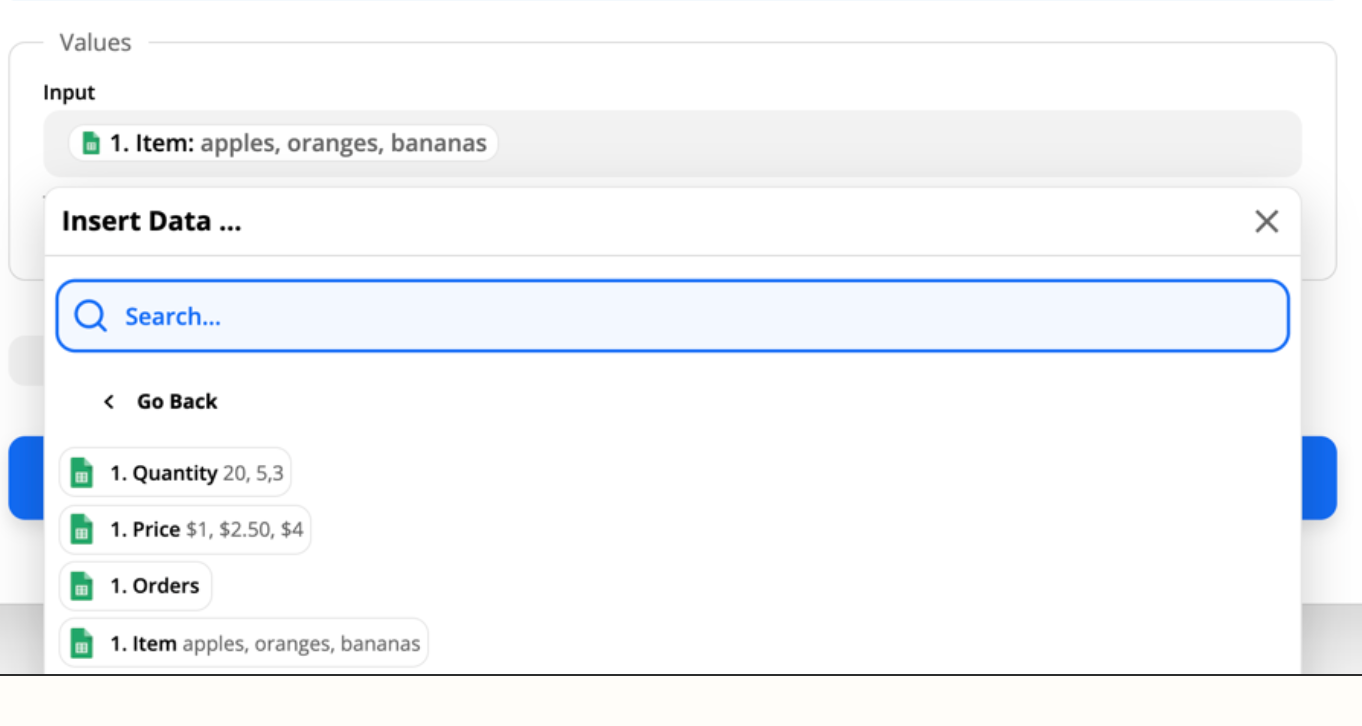
When you pull data, you should see values. In the example below, you can see the values when the input item is selected.
I have sometimes had this problem when I create the Zap before adding data to my spreadsheet, you can go back and refresh your spreadsheet in the first step and you should see input. Also, make sure to select a row that has complete data in this step.
Hope this helps @Britta Burket. If not, let me know.
Hi again @makelearning, I did refresh the data for several times and nothing changes.
Now I start questioning my logic what item from selection to use on “To” row. My personal logic says that it should be E-mail :) and not entire data row. The other questionable part is this:
Although automatically the question answers and everything is recorded horizontally and the data in general is in columns. Here however is marked Row C, B etc. Maybe I’m already overthinking :).
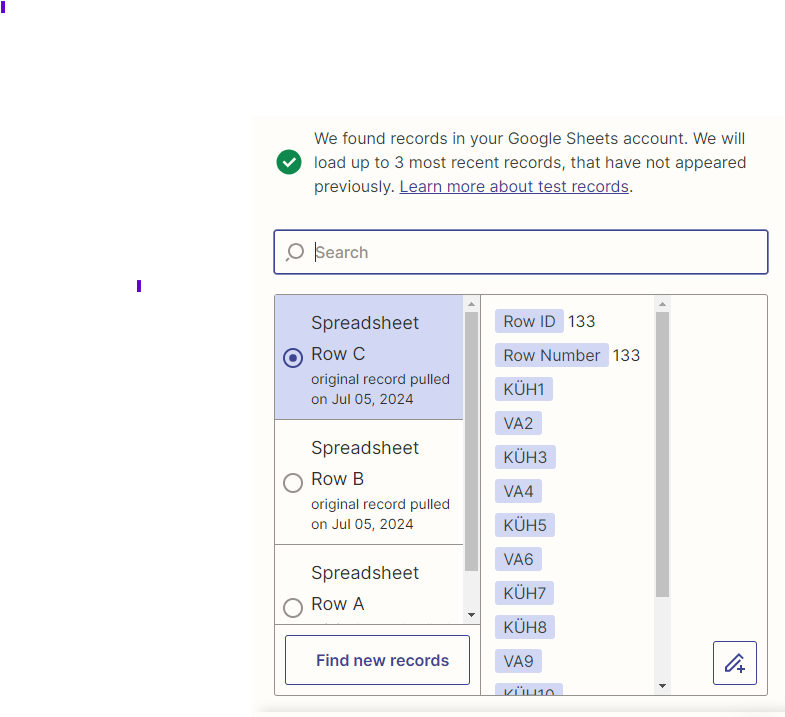
Hi @Britta Burket I believe the problem is you are using Row C. Looking at your earlier screenshot below
you have 3 rows. Row C is the last row, which doesn’t have any data except 2 placeholders, presumably where you are using the formula to calculate scores.. Rows A&B appear to be actual test results from you and another user. Can you please try again using Row A or B?
Hello again @Britta Burket, so I just tried it out myself with Google Sheets and ultimately got it to work on my end, but ran into the same problem! So, it appears there’s some sort of glitch somewhere in the Sheets - Typeform - Zapier pipeline, as I didn’t have this problem with Notion.
In any case, here’s what to do, the short version:
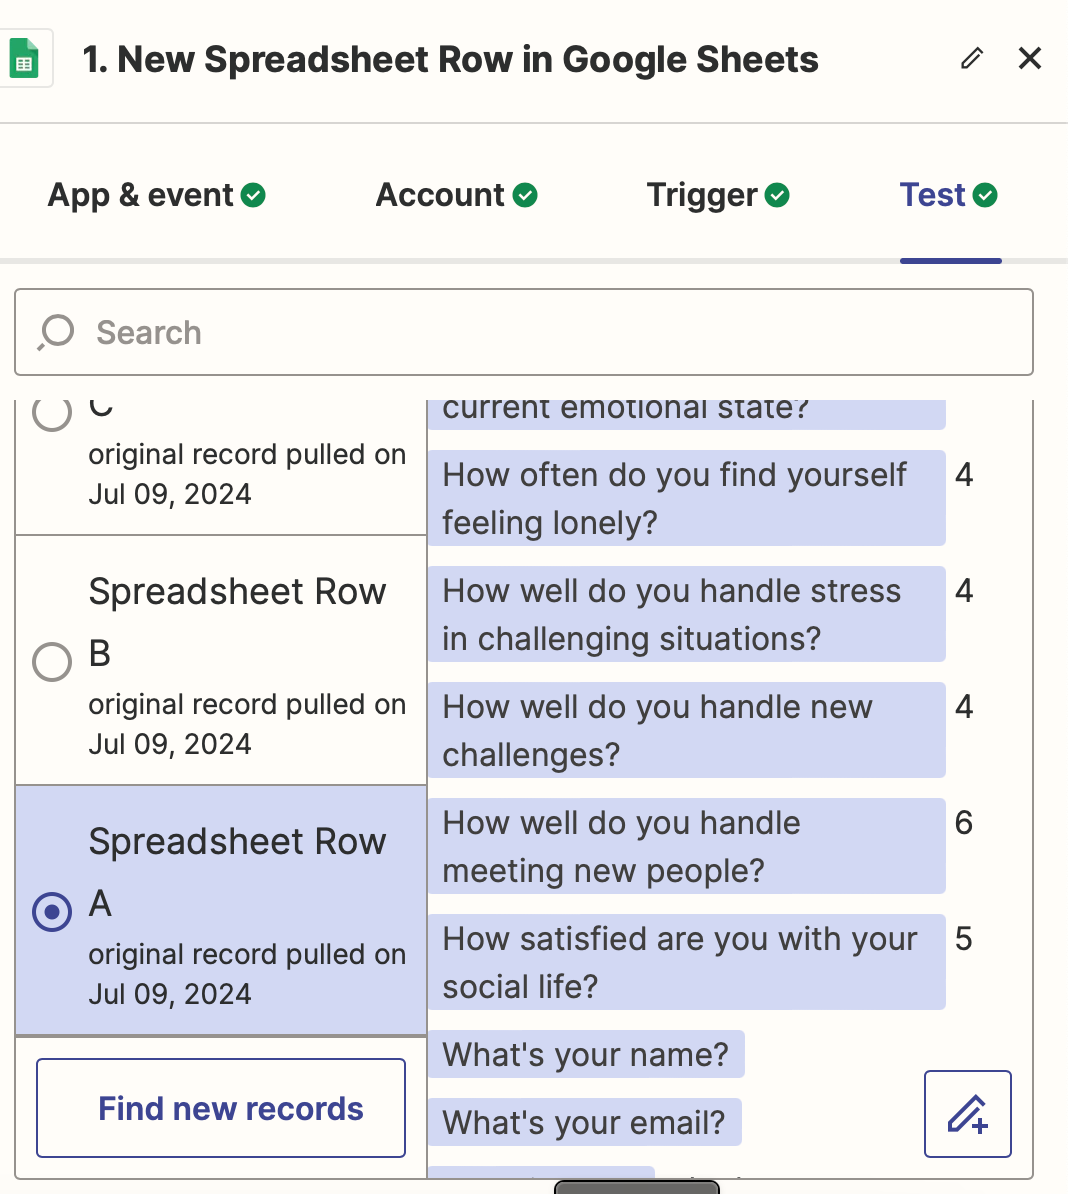
When you get to the step you tested above, take the test again, and then select the new record. I’ve recorded that process step-by-step below in case you need the long version…
When you get to this stage below look for the name and email field. In my case it was recording all of the data, except the name and data field as shown below.
The workaround is when this happens, go back to your Typeform and take the test again to generate a new result while leaving this screen open.
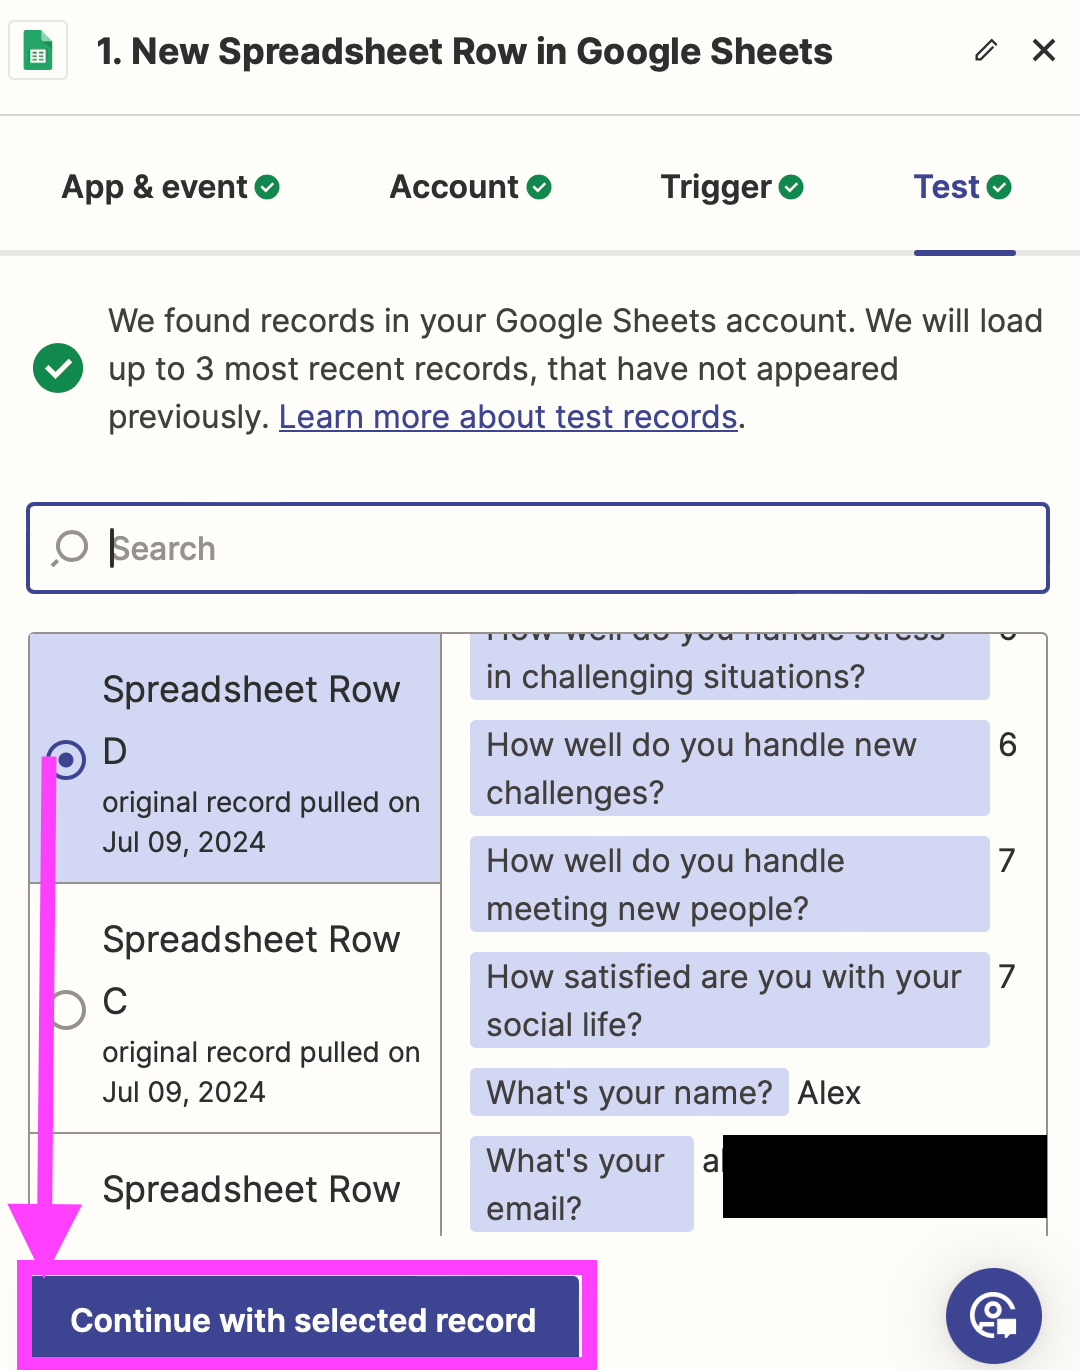
Wait a few moments and go back to Zapier and select the *Find New Records* button. Then scroll to the top and select the most recent record, which should be Row D. This result has the name and email. See below.
Note: If you get an error or no new results, give it another 5 minutes and try again.
So then you select “Continue with Selected Record” at the bottom.
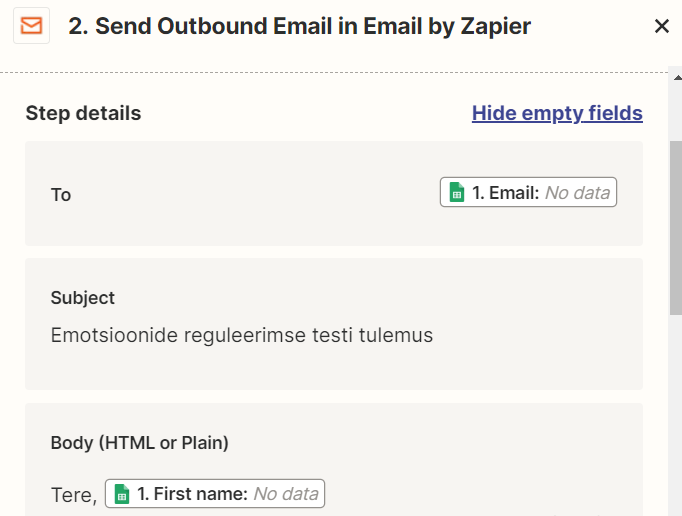
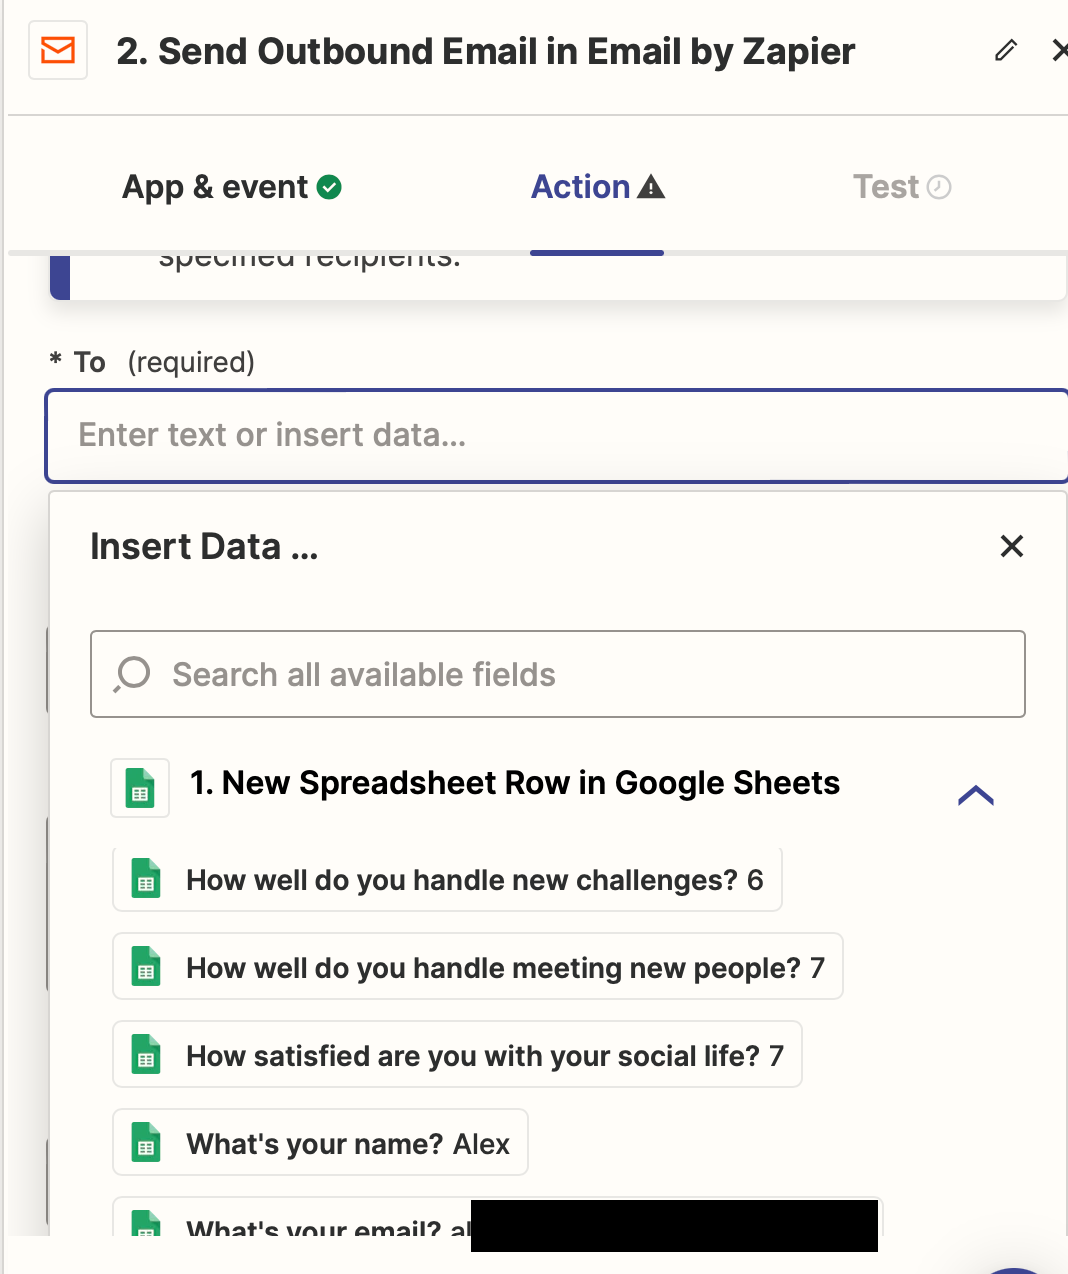
Now, you follow the prompts to create your email. When I go to the To field, I see the following. Notice the data is visible next to the fields. Just scroll down to email:
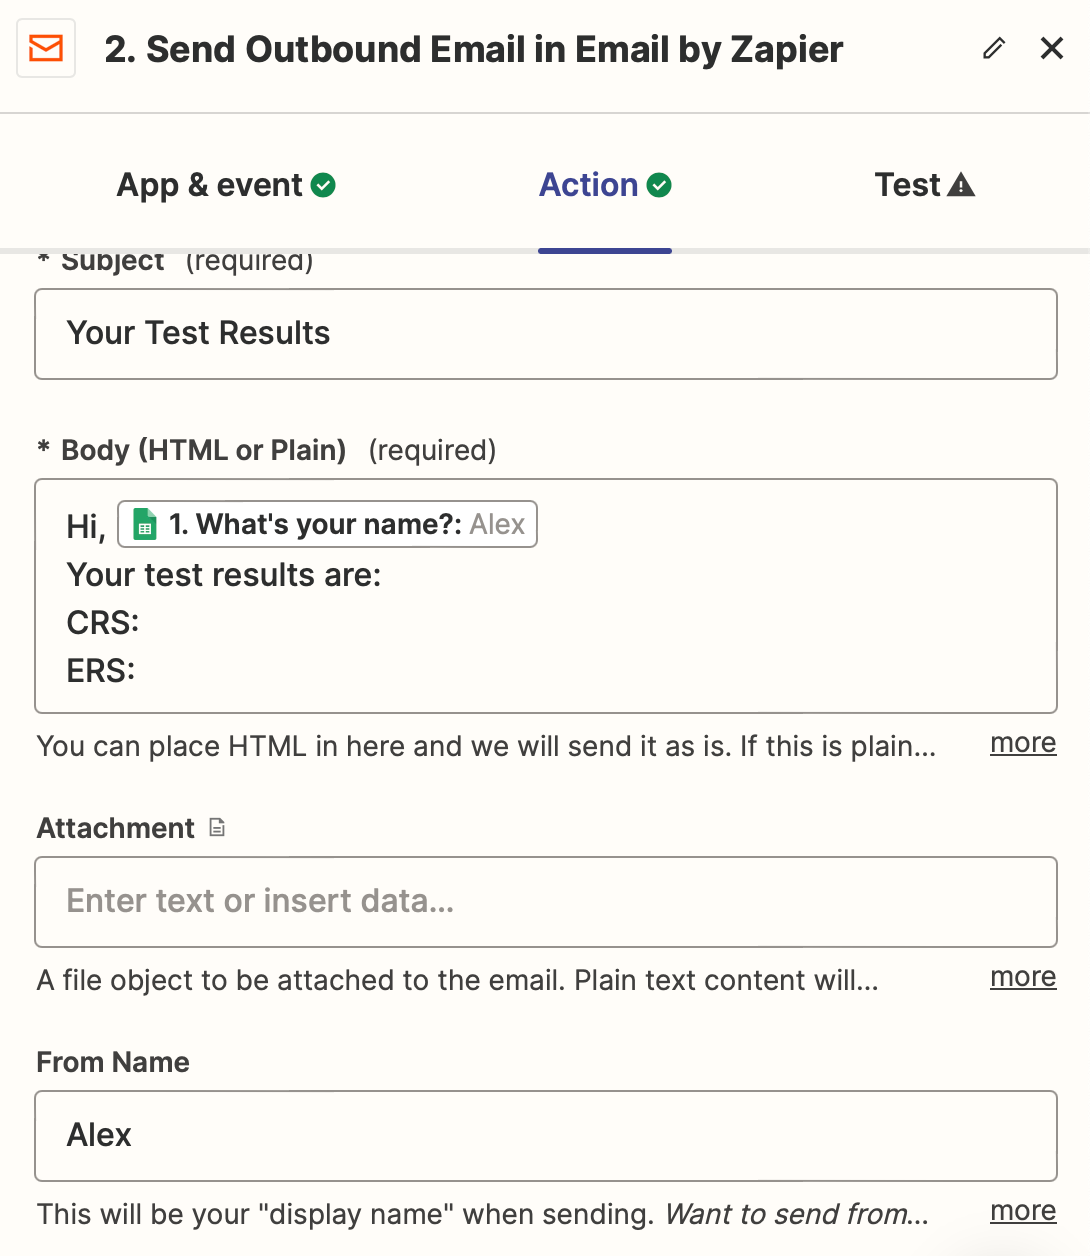
The data appears in the corresponding field when you select it. In this case, you see “Alex” in gray, next to “What’s your name?:”, so you know it captured the data. The same for email.
Everything worked on my end and I got the email! Let me know how it works for you 🙏🏽🙏🏽Hoping this will work.
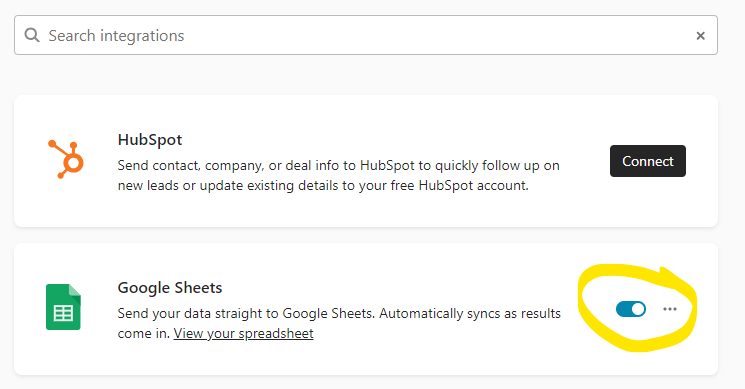
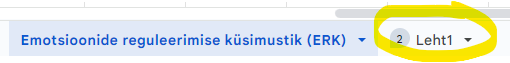
@makelearning Thank you for the tips! I did follow up the steps and I changed the sheet (I created a sheet with results and what calculates the average result), since I had one automatic test results sheet and then the other where I calculated the results (circled in yellow).
When I now changed the automatic sheet with no average results, then I got the data into the Zap and I found the e-mail in my spam folder. It does seem like a win 😄!
Now I only have an issue with result calculation, since the first Sheet (ERK) do not have the average calculation because this is the part what I’m unable to do in Typeform and when I add these two columns to the sheet, then it warns me that it will break the link (and in reality it did broke).
In a way I’m back from the beginning with a circle 😣. When I use the original data sheet I do see the records, and when I connect it with data collection sheet, then it does not provide the records I need.
@Britta Burket - to avoid “breaking’ the sheet, I always recommend that people create a second tab in their Google Sheet where they pull the data entries from typeform submission (using arrayformula() function to do so automatically when a new record is received. You can add all the additional calculated fields you want on this separate tab and do your reporting/emailing from it
@john.desborough - I did try this version with the second sheet where I did the calculations, but Zapier do not understand the values from the other sheet and therefore do not make the e-mail sending automatic.
I was thinking the same that when I carry over the values, then I can make the necessary calculations.
Hi @Britta Burket I am sorry the solution isn’t working for you. What @john.desborough works and I’d recommend doing that. Unfortunately, I am not able to post the steps here at this time. If you still have trouble, This would be something a Typeform agency partner can help with—you can find a list here: https://www.partnerhub.directory/typeform-partners/