Hey everyone,
I'm Technical Lead on the Typeform Support team at Typeform – it's nice to be here in the community with you all :)
I want to share with you a solution I discovered for creating automated reports with Typeform and GSuite.
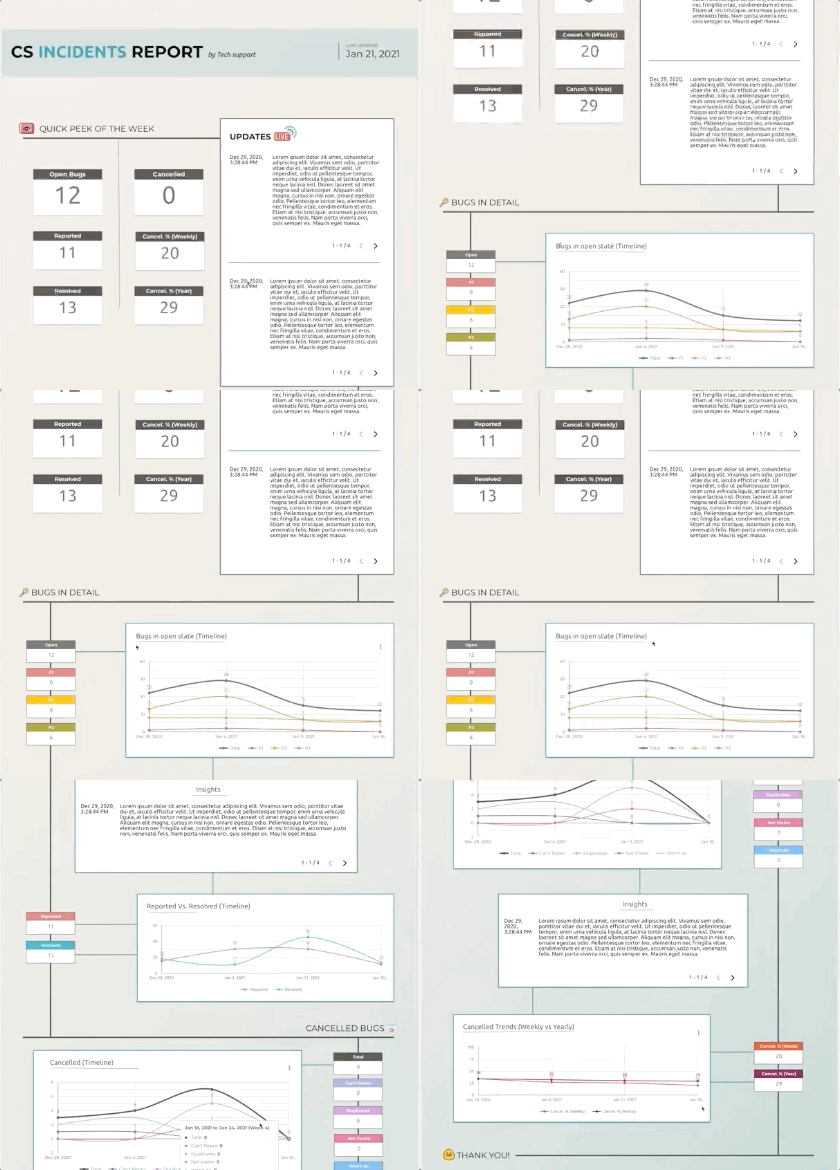
As part of my role I need to send a weekly report (pictured below) to my leadership about the incidents in JIRA that are impacting or have impacted customers this week.

I was wasting a heck of a lot of time before, copying and pasting the numbers and screenshots of the graphs from JIRA into a manual template. Because the report is worked on by all my team members it looks different every week. Also, people were forgetting to share information, sometimes (we are humans after all).
So, what's the solution?
So I decided to automate things as much as possible in order to save time and make life easier:
- I made a typeform to collect the data. It would log all the info I needed for the report (e.g. how many bugs we opened, what the priorities were, what is our cancellation rate, etc.)
- I send all that data to a shared Google Sheets document.
- 3. I use the data from the Google Sheet to create an automated report with nice looking graphs using Google Data Studio.
Here's how it works:
How to make it yourself
In this post I'll give an overview of the steps needed to make the solutions, with some video explainers.
You can also download the guide I made 📕 which goes into much more depth and gives an outline of all the questions I used. If you take the short route you'll be up to speed in about 30 mins, if you want to devour everything related to my specific use case it'll take a good two or three hours.
Step 1: Create the typeform
I created a typeform that my team could use to submit the information we need to generate the reports. It allows us to capture things like:
-
How many bugs were opened
-
Updates about particular issues
-
Information about service disruptions
I password-protected the typeform so that only designated team members are able to access and generate the reports. I also made use of the simpler logic capabilities in the new builder to route people through the form in a "conversational" way.
Here's an overview of how the form is made:
Here's a copy of the form so you can play around with it in your own Workspace and have a look at what's inside.
If you want even more detail on how I made the form get some popcorn ready and settle down to watch this three-part step-by-step video series:
-
Part 1: Setting up the password entry, adding question groups and Logic (31 mins)
-
Part 2: Using Layouts to add instructional screenshots, capturing details of bugs reported (21 mins)
-
Part 3: Setting up a typeform to capture service disruptions, checking an publishing the form (12 mins)
Step 2: Connect to Google Data Studio through Google Sheets
Once the typeforms are created, they are connected to Google Sheets using the process explained in this Help Center article.
One this is set up, the data from the sheet is sent to be modelled and visualized in Google Data Studio. In fact, you could use any other data visualization tool you are familiar with if they accept Google Sheet documents as a source. Because it’s free and because it’s pretty easy to use I'm using Google Data Studio.
Once signed into Google Data Studio you can connect the data by clicking Create>Data Source and finding your Google Sheet. For more detailed instructions on this, check out page 7 of my PDF guide.
Once connected, you'll move through to the data modelling screen in Google Data Studio. This is where you configure the data sources for your reports, before clicking the 'Create Report' button to generate the report. Here's another video to show you how all this works:
Step 3: Build the reports
Finally, the fun part – creating the reports. Google Data Studio gives you a lot of control on how your finished reports look, as well as what information they will show. The video below will give you an idea of what our finished support incidents report looks like once generated:
If you want more specifics on how to design and set up the reports here are some more in-depth videos:
And that's it! I hope all this information is helpful and that you'll find a way to apply it to your own use cases. Do let me know if you have any questions. We would love to know what you think of the post – be honest – so our content curator
Got a sweet, sweet workflow like Nordin's that you'd like to share? Let us know below and we'll get back to you to discuss how we might be able to feature it to help inspire others 💪


 I’m a report freak too, when I get started I even dream with them. I’ll be sharing some more use cases with you all once I get some time. If you tell me what’s yours maybe I can add it to the list and show some cool forms / dasbhoards for your use case

